2nd Grade Common Core Data and Graphing Resources
Common Core Quick Links:
Common Core Standards for 2nd Grade Math, Common Core Standards for 2nd Grade ELA51 results
Math
✕2nd Grade
✕Common Core
✕51 results
2nd Grade Common Core Data and Graphing Resources
Common Core Quick Links:
Common Core Standards for 2nd Grade Math, Common Core Standards for 2nd Grade ELA51 results
Math
✕2nd Grade
✕Common Core
✕51 results


About 2nd Grade Common Core Data And Graphing Resources
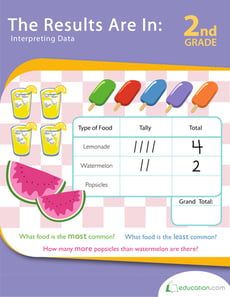
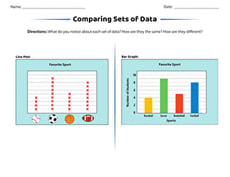
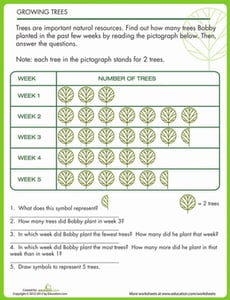
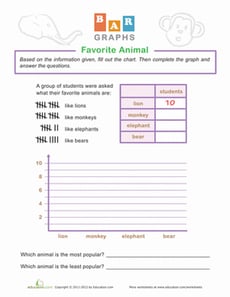
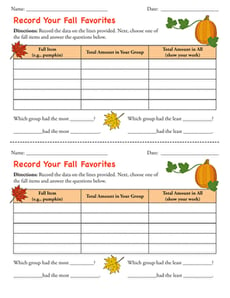
On Education.com, the 2nd Grade Common Core Data and Graphing Resources provide educators and parents with a wide variety of printable charts, worksheets, and lesson plans that help students develop data collection and graphing skills. These resources focus on helping 2nd-grade learners interpret and create bar graphs, line graphs, and pictographs to represent data accurately. Each activity supports foundational math standards while encouraging critical thinking and visual analysis. Educators can use these materials to reinforce classroom lessons, track progress, or foster hands-on learning at home.
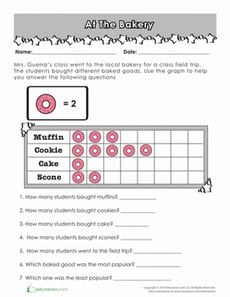
The resources include organized PDF worksheets tailored for classroom or home use, interactive games that challenge students to analyze data sets, and comprehensive practice exercises for chart creation. These carefully curated educational materials enable learners to connect mathematical concepts to real-world applications like surveys, experiments, or measuring trends. Parents and teachers can quickly access ready-made content that saves planning time while providing engaging, standards-aligned practice.
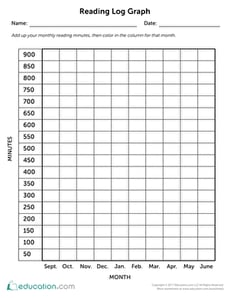
Using the provided worksheets, breakout classroom activities, or interactive digital lessons on Education.com helps students to familiarize themselves with graphical representation, data analysis, and observational skills. These materials support structured learning or extend classroom lessons, providing both guidance and practice for young Data and Graphs students. Whether for homework, such as creating bar charts based on class surveys, or classroom learning, these resources make practicing core math concepts accessible and enjoyable.
The resources include organized PDF worksheets tailored for classroom or home use, interactive games that challenge students to analyze data sets, and comprehensive practice exercises for chart creation. These carefully curated educational materials enable learners to connect mathematical concepts to real-world applications like surveys, experiments, or measuring trends. Parents and teachers can quickly access ready-made content that saves planning time while providing engaging, standards-aligned practice.
Using the provided worksheets, breakout classroom activities, or interactive digital lessons on Education.com helps students to familiarize themselves with graphical representation, data analysis, and observational skills. These materials support structured learning or extend classroom lessons, providing both guidance and practice for young Data and Graphs students. Whether for homework, such as creating bar charts based on class surveys, or classroom learning, these resources make practicing core math concepts accessible and enjoyable.