Painting & Drawing Data and Graphing Activities
1 result
Math
✕Activities
✕Painting & Drawing
✕1 result
Subtopics:
Painting & Drawing Data and Graphing Activities
1 result
Math
✕Activities
✕Painting & Drawing
✕1 result

About Painting & Drawing Data And Graphing Activities
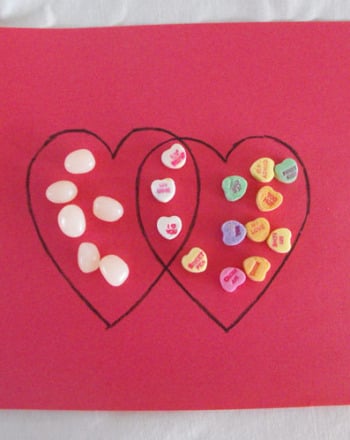
On Education.com, painting and drawing data and graphing activities combine art with math to help students visualize and analyze information. These activities encourage children to create pictographs, bar graphs, and Venn diagrams using drawings, shapes, and colors. They make abstract math concepts hands-on and engaging, fostering creativity and critical thinking in young learners. Educators can use printable worksheets and guided lessons to reinforce chart-reading skills while nurturing artistic expression.
Painting and drawing data and graphing worksheets and classroom activities on Education.com include lessons for plotting classroom votes, favorite foods, and class survey results. Resources also provide step-by-step instructions for creating messages through visual storytelling and hands-on craft projects to teach data interpretation. Each page offers practical tools to integrate art into math lessons, enabling students to practice graphing while enjoying creative expression.
Parents and teachers benefit from these resources by saving time on lesson planning, accessing ready-made activities that make learning fun and interactive. With clear examples and structured exercises, children can independently practice data collection, organization, and interpretation through visually attractive drawings. This approach enhances understanding of mathematical concepts in a way that is accessible and enjoyable.