Common Core Data and Graphing Interactive Worksheets
Common Core Quick Links:
Common Core State Standards15 results
Math
✕Interactive Worksheets
✕Common Core
✕15 results
Common Core Data and Graphing Interactive Worksheets
Common Core Quick Links:
Common Core State Standards15 results
Math
✕Interactive Worksheets
✕Common Core
✕15 results


About Common Core Data And Graphing Interactive Worksheets
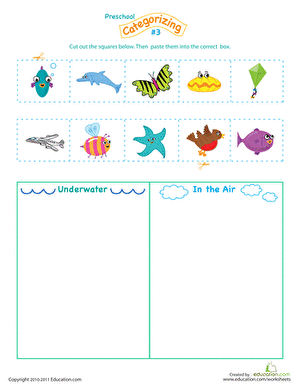
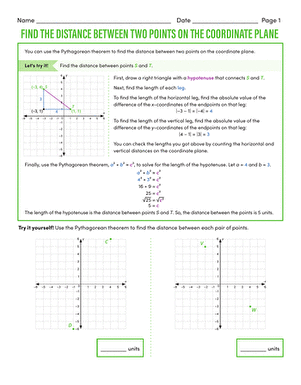
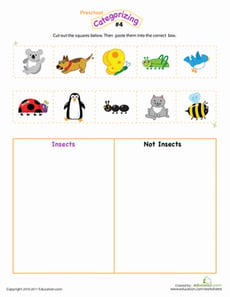
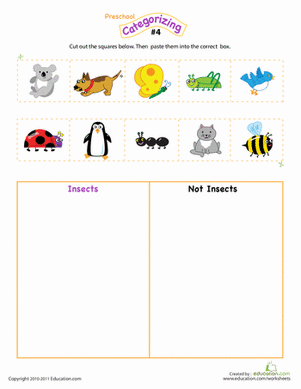
On Education.com, students can explore Common Core data and graphing interactive worksheets that teach how to collect, organize, and interpret data through activities such as creating bar graphs, pictographs, line plots, scatter plots, and Venn diagrams. These resources provide hands-on practice for a wide range of skills, from basic sorting and counting for young learners to complex statistical analysis for older students. The worksheets are designed to meet educational standards and build confidence in working with data. By using these interactive pages, educators and parents can reinforce classroom lessons, track progress, and engage students with meaningful mathematical thinking.
Education.com offers a variety of digital simulations, printable activities, and interactive lessons that support learning data collection, interpretation, and graphing skills. These resources enable learners to develop mathematical fluency while applying concepts to real-world contexts. Educators and parents can access structured practice that aligns with curriculum standards. The site provides materials suitable for classrooms and at-home learning, making it simple to introduce students to both elementary and more advanced graphing methods.
Using these data and graph worksheets, students can apply critical thinking and analytical skills to organize information visually. Educators can save time by providing ready-made activities that reinforce key concepts in an engaging way. Parents can access resources to support homework and encourage hands-on learning. Together, these worksheets recognize the importance of integrating mathematics with technology and provide a foundation for future data analysis and problem-solving.