SKIP TO CONTENT
Worksheet Generator
Subjects
Grades
Worksheets
Games
Build a Worksheet
More Resources
Roly Recommends
Summer Boost
Subjects
Grades
Worksheets
Games
Build a Worksheet
More Resources
Roly Recommends
Summer Boost
1st - 4th Grade Data and Graphing Resources : Page 5
Filters
Math
Data and Graphing
261 results
Math
✕
1st - 4th Grade
✕
Clear all
261 results
Subtopics:
Collecting and Organizing Data
Picture Graphs
Bar Graphs
Line Plots
Coordinate Plane
Show Less
Filters
Math
✕
1st - 4th Grade
✕
Subjects
Math
English Language Arts
Science
Social Studies
Foreign Language
Grade Level
Pre-K
K
1st
2nd
3rd
4th
5th
6th
7th
8th
Early Childhood
Elementary School
Middle School
Resource Type
Worksheets
Games
Lesson Plans
Interactive Worksheets
Workbooks
Activities
Exercises
Offline Games
Guided Lessons
Teacher Resources
Occasion
Birthdays
Summer
Back to School
Halloween
Winter
Holidays
Hanukkah
Valentine's Day
Common Core
Yes
Game Type
Ball Games
Arts & Crafts
Arts & Crafts
Paper & Glue Crafts
English Language Support
Yes
Clear all
View 261 results
1st - 4th Grade Data and Graphing Resources : Page 5
Filters
261 results
Math
✕
1st - 4th Grade
✕
Clear all
261 results
Reading Pictographs: Drink Your Milk!
Worksheet
Reading Pictographs: Drink Your Milk!
Third Grade
Data and Graphing
Can your child help Tommy figure out how much milk he drinks? As she does, she'll learn how to read and interpret data in graphs and practice multiplication.
Worksheet
Reading Pictographs: Drink Your Milk!
Worksheet
Reading Pictographs: Drink Your Milk!
Can your child help Tommy figure out how much milk he drinks? As she does, she'll learn how to read and interpret data in graphs and practice multiplication.
Third Grade
Data and Graphing
Worksheet
Interpreting Line Plots with Fractional Units
Worksheet
Interpreting Line Plots with Fractional Units
Third Grade
Data and Graphing
In this third grade worksheet, kids will interpret a line plot that includes fractional units.
Worksheet
Interpreting Line Plots with Fractional Units
Worksheet
Interpreting Line Plots with Fractional Units
In this third grade worksheet, kids will interpret a line plot that includes fractional units.
Third Grade
Data and Graphing
Worksheet
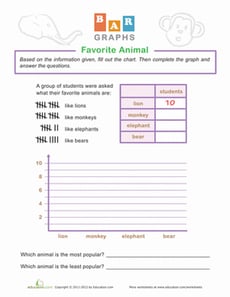
Bar Graphs
Worksheet
Bar Graphs
Second Grade
Data and Graphing
What is the class's favorite animal? Get your student ready for graphing with this fun bar graph worksheet!
Worksheet
Bar Graphs
Worksheet
Bar Graphs
What is the class's favorite animal? Get your student ready for graphing with this fun bar graph worksheet!
Second Grade
Data and Graphing
Worksheet
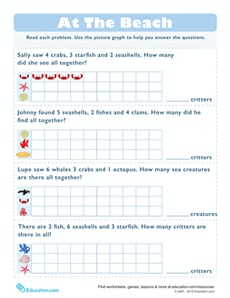
Learning Charts
Worksheet
Learning Charts
First Grade
Data and Graphing
Take math practice to the beach with this intro to pictographs! Practice drawing each word problem on the chart.
Worksheet
Learning Charts
Worksheet
Learning Charts
Take math practice to the beach with this intro to pictographs! Practice drawing each word problem on the chart.
First Grade
Data and Graphing
Worksheet
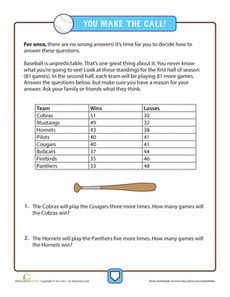
Baseball Predictions
Worksheet
Baseball Predictions
Fourth Grade
Data and Graphing
A math challenge worksheet with no wrong answers! Look at standings for a baseball league and make predictions based on numbers.
Worksheet
Baseball Predictions
Worksheet
Baseball Predictions
A math challenge worksheet with no wrong answers! Look at standings for a baseball league and make predictions based on numbers.
Fourth Grade
Data and Graphing
Worksheet
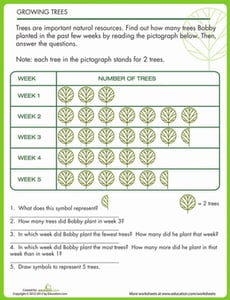
Tree Pictograph
Worksheet
Tree Pictograph
Second Grade
Data and Graphing
Your child can practice basic math and symbol recognition with this pictograph worksheet.
Worksheet
Tree Pictograph
Worksheet
Tree Pictograph
Your child can practice basic math and symbol recognition with this pictograph worksheet.
Second Grade
Data and Graphing
Worksheet
Probability and Statistics 1
Exercise
Probability and Statistics 1
Third Grade
Data and Graphing
This engaging exercise will introduce students to probability and statistics in a way that excites them to continue learning.
Exercise
Probability and Statistics 1
Exercise
Probability and Statistics 1
This engaging exercise will introduce students to probability and statistics in a way that excites them to continue learning.
Third Grade
Data and Graphing
Exercise
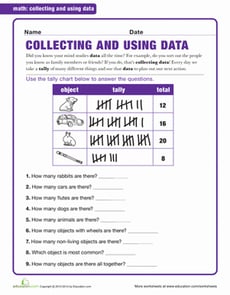
Using Data
Worksheet
Using Data
First Grade
Data and Graphing
This worksheet provides excellent practice adding, interpreting, and organizing information.
Worksheet
Using Data
Worksheet
Using Data
This worksheet provides excellent practice adding, interpreting, and organizing information.
First Grade
Data and Graphing
Worksheet
Books Picto-Graph
Worksheet
Books Picto-Graph
Second Grade
Data and Graphing
Hey bookworms, can you read this pictograph? Give your second grader a fun way to practice reading and using graphs with this quiz-style worksheet.
Worksheet
Books Picto-Graph
Worksheet
Books Picto-Graph
Hey bookworms, can you read this pictograph? Give your second grader a fun way to practice reading and using graphs with this quiz-style worksheet.
Second Grade
Data and Graphing
Worksheet
Reading Pictographs: Carrots for Bunnies
Worksheet
Reading Pictographs: Carrots for Bunnies
Third Grade
Data and Graphing
How many carrots did Sammy's pet bunny eat? Kids use information in the pictograph to answer word problems in this bunny-filled math worksheet.
Worksheet
Reading Pictographs: Carrots for Bunnies
Worksheet
Reading Pictographs: Carrots for Bunnies
How many carrots did Sammy's pet bunny eat? Kids use information in the pictograph to answer word problems in this bunny-filled math worksheet.
Third Grade
Data and Graphing
Worksheet
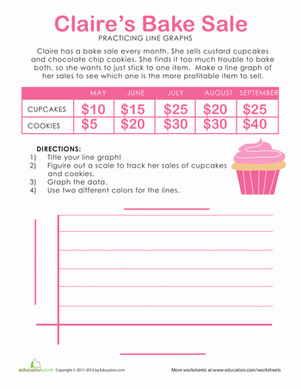
Making Sweet Line Graphs!
Worksheet
Making Sweet Line Graphs!
Second Grade
Data and Graphing
Satisfy your sweet tooth, and practice graphing at the same time! Practice making a line graph using the information given.
Worksheet
Making Sweet Line Graphs!
Worksheet
Making Sweet Line Graphs!
Satisfy your sweet tooth, and practice graphing at the same time! Practice making a line graph using the information given.
Second Grade
Data and Graphing
Worksheet
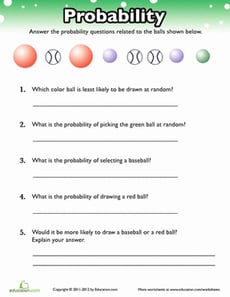
Probability Practice
Worksheet
Probability Practice
Fourth Grade
Data and Graphing
Get some practice with probability! With this exercise, your child will practice using fractions to express probability of different outcomes.
Worksheet
Probability Practice
Worksheet
Probability Practice
Get some practice with probability! With this exercise, your child will practice using fractions to express probability of different outcomes.
Fourth Grade
Data and Graphing
Worksheet
Favorite Cities Bar Graph
Worksheet
Favorite Cities Bar Graph
Second Grade
Data and Graphing
Can your second grader make her own bar chart? Use this pretend survey of 38 people and their favorite cities to find out!
Worksheet
Favorite Cities Bar Graph
Worksheet
Favorite Cities Bar Graph
Can your second grader make her own bar chart? Use this pretend survey of 38 people and their favorite cities to find out!
Second Grade
Data and Graphing
Worksheet
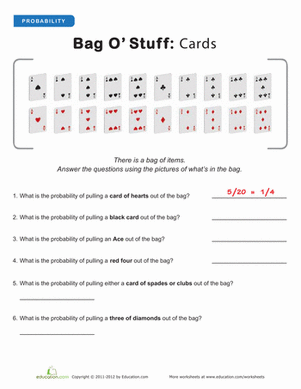
Intro to Probability: Playing Cards
Worksheet
Intro to Probability: Playing Cards
Fourth Grade
Data and Graphing
We don't condone gambling, but here's a fun worksheet to learn probability with playing cards.
Worksheet
Intro to Probability: Playing Cards
Worksheet
Intro to Probability: Playing Cards
We don't condone gambling, but here's a fun worksheet to learn probability with playing cards.
Fourth Grade
Data and Graphing
Worksheet
Measurement and Data 2
Guided Lesson
Measurement and Data 2
First Grade
Measurement
Measurement and data in first grade includes such important concepts as comparing the length and weight of two objects using a third object. This guided lesson, designed by curriculum experts, takes students on an exploration of these measurement and data concepts. Once through with the lesson, kids can gain extra practice with measurement and data with the accompanying worksheets.
Guided Lesson
Measurement and Data 2
Guided Lesson
Measurement and Data 2
Measurement and data in first grade includes such important concepts as comparing the length and weight of two objects using a third object. This guided lesson, designed by curriculum experts, takes students on an exploration of these measurement and data concepts. Once through with the lesson, kids can gain extra practice with measurement and data with the accompanying worksheets.
First Grade
Measurement
Guided Lesson
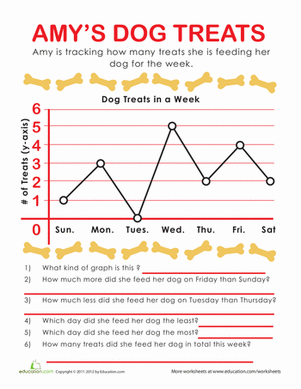
Graphing Practice
Worksheet
Graphing Practice
Second Grade
Data and Graphing
Help Amy track the dog treats she's given out this week. Your kid can practice reading, using graphs, and doing basic arithmetic, with this worksheet.
Worksheet
Graphing Practice
Worksheet
Graphing Practice
Help Amy track the dog treats she's given out this week. Your kid can practice reading, using graphs, and doing basic arithmetic, with this worksheet.
Second Grade
Data and Graphing
Worksheet
Create a Line Plot (With Your Own Data!)
Worksheet
Create a Line Plot (With Your Own Data!)
Second Grade
Data and Graphing
Invite students to become researchers with this open-ended line plot template!
Worksheet
Create a Line Plot (With Your Own Data!)
Worksheet
Create a Line Plot (With Your Own Data!)
Invite students to become researchers with this open-ended line plot template!
Second Grade
Data and Graphing
Worksheet
BBQ Food: Venn Diagram for Kids
Worksheet
BBQ Food: Venn Diagram for Kids
Second Grade
Data and Graphing
Do you have a favorite BBQ food? Find out how to keep track of your friends' favorite foods with this Venn diagram for kids.
Worksheet
BBQ Food: Venn Diagram for Kids
Worksheet
BBQ Food: Venn Diagram for Kids
Do you have a favorite BBQ food? Find out how to keep track of your friends' favorite foods with this Venn diagram for kids.
Second Grade
Data and Graphing
Worksheet
Water Vehicles
Worksheet
Water Vehicles
Kindergarten
Data and Graphing
Can you tell which of these vehicles travels by water? Get a review of transportation with your kindergartener.
Worksheet
Water Vehicles
Worksheet
Water Vehicles
Can you tell which of these vehicles travels by water? Get a review of transportation with your kindergartener.
Kindergarten
Data and Graphing
Worksheet
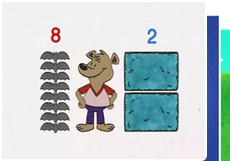
Super Shapes: Count and Graph
Worksheet
Super Shapes: Count and Graph
Kindergarten
Geometry
Introduce kids to key math skills on this shape-filled worksheet. Kids count and color the different shapes, then make a graph to show how many are pictured.
Worksheet
Super Shapes: Count and Graph
Worksheet
Super Shapes: Count and Graph
Introduce kids to key math skills on this shape-filled worksheet. Kids count and color the different shapes, then make a graph to show how many are pictured.
Kindergarten
Geometry
Worksheet
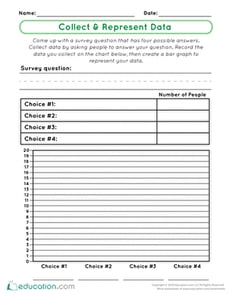
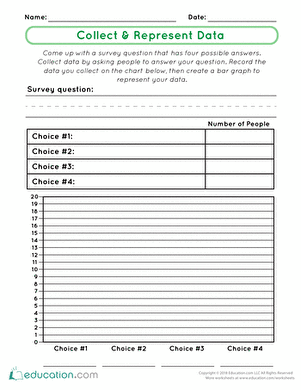
Collect & Represent Data
Worksheet
Collect & Represent Data
First Grade
Data and Graphing
Use this activity to assess your students’ abilities to collect and represent data. Students will come up with a survey question, collect and record the data, and then create a bar graph to represent the survey results.
Worksheet
Collect & Represent Data
Worksheet
Collect & Represent Data
Use this activity to assess your students’ abilities to collect and represent data. Students will come up with a survey question, collect and record the data, and then create a bar graph to represent the survey results.
First Grade
Data and Graphing
Worksheet
Garden Graphing: Count and Color!
Worksheet
Garden Graphing: Count and Color!
First Grade
Data and Graphing
Carrots, turnips and potatoes, oh my! Count how many of each vegetable our furry farmer picked and then fill in the graph for each vegetable.
Worksheet
Garden Graphing: Count and Color!
Worksheet
Garden Graphing: Count and Color!
Carrots, turnips and potatoes, oh my! Count how many of each vegetable our furry farmer picked and then fill in the graph for each vegetable.
First Grade
Data and Graphing
Worksheet
Using Base 10 Drawings in Two-Digit Addition
Worksheet
Using Base 10 Drawings in Two-Digit Addition
Second Grade
Addition
This worksheet teaches you to use base 10 drawings to add two-digit numbers.
Worksheet
Using Base 10 Drawings in Two-Digit Addition
Worksheet
Using Base 10 Drawings in Two-Digit Addition
This worksheet teaches you to use base 10 drawings to add two-digit numbers.
Second Grade
Addition
Worksheet
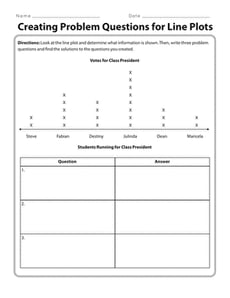
Creating Problem Questions for Line Plots
Worksheet
Creating Problem Questions for Line Plots
Third Grade
Data and Graphing
It’s time to flex your math muscles! Use this resource to have your students look at a line plot and create questions.
Worksheet
Creating Problem Questions for Line Plots
Worksheet
Creating Problem Questions for Line Plots
It’s time to flex your math muscles! Use this resource to have your students look at a line plot and create questions.
Third Grade
Data and Graphing
Worksheet
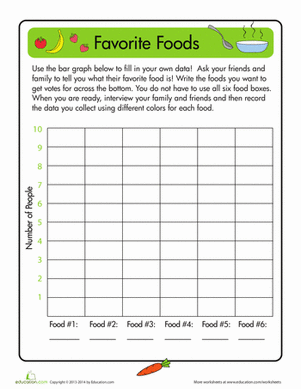
Favorite Foods
Worksheet
Favorite Foods
First Grade
Data and Graphing
Your child can learn to create a bar graph while having fun asking people questions.
Worksheet
Favorite Foods
Worksheet
Favorite Foods
Your child can learn to create a bar graph while having fun asking people questions.
First Grade
Data and Graphing
Worksheet
Jake's Nature Hike
Worksheet
Jake's Nature Hike
Second Grade
Data and Graphing
How many animals have you seen on your hikes? Jake saw many animals on his! Create your own bar graph with the information given.
Worksheet
Jake's Nature Hike
Worksheet
Jake's Nature Hike
How many animals have you seen on your hikes? Jake saw many animals on his! Create your own bar graph with the information given.
Second Grade
Data and Graphing
Worksheet
Zoo Animal Pie Chart
Worksheet
Zoo Animal Pie Chart
Second Grade
Data and Graphing
Help your child gain his bearings around charts and graphs with these cute, nonthreatening pie charts.
Worksheet
Zoo Animal Pie Chart
Worksheet
Zoo Animal Pie Chart
Help your child gain his bearings around charts and graphs with these cute, nonthreatening pie charts.
Second Grade
Data and Graphing
Worksheet
Probability Quiz
Worksheet
Probability Quiz
Fourth Grade
Data and Graphing
Here's a great opportunity for your child to practice probability! He'll solve word problems about the probability of choosing an item from a group.
Worksheet
Probability Quiz
Worksheet
Probability Quiz
Here's a great opportunity for your child to practice probability! He'll solve word problems about the probability of choosing an item from a group.
Fourth Grade
Data and Graphing
Worksheet
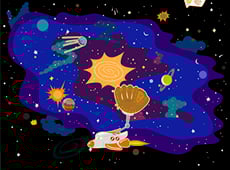
Scaled Bar Graphs in Space
Game
Scaled Bar Graphs in Space
Third Grade
Data and Graphing
Out of this world! Kids help Roly collect, sort, and graph random objects in this silly space game.
Game
Scaled Bar Graphs in Space
Game
Scaled Bar Graphs in Space
Out of this world! Kids help Roly collect, sort, and graph random objects in this silly space game.
Third Grade
Data and Graphing
Game
Probability and Statistics 2
Exercise
Probability and Statistics 2
Fourth Grade
Data and Graphing
Continue the probability and statistics fun with this involving exercise that shows students how to use data to make predictions.
Exercise
Probability and Statistics 2
Exercise
Probability and Statistics 2
Continue the probability and statistics fun with this involving exercise that shows students how to use data to make predictions.
Fourth Grade
Data and Graphing
Exercise
1
…
4
5
6
…
9