SKIP TO CONTENT
Worksheet Generator
Subjects
Grades
Worksheets
Games
Build a Worksheet
More Resources
Roly Recommends
Reading Month
Subjects
Grades
Worksheets
Games
Build a Worksheet
More Resources
Roly Recommends
Reading Month
All Subjects
Math
Data and Graphing
Subtopics:
Collecting and Organizing Data
Picture Graphs
Bar Graphs
Line Plots
Coordinate Plane
Box Plots
Histograms
Show Less
Filters
Search for: reading, information, us, cities, ii
✕
Math
✕
Worksheets
✕
Subjects
Math
English Language Arts
Science
Social Studies
Foreign Language
Grade Level
Pre-K
K
1st
2nd
3rd
4th
5th
6th
7th
8th
Early Childhood
Elementary School
Middle School
Resource Type
Worksheets
Games
Lesson Plans
Interactive Worksheets
Workbooks
Activities
Offline Games
Guided Lessons
Occasion
Summer
Back to School
Holidays
Valentine's Day
Common Core
Yes
Game Type
Printable Board Games
Coloring
Yes
See More
Clear All
View 95 results
Showing Results for reading information us cities ii : Page 4
95 results
Search for: reading, information, us, cities, ii
✕
Math
✕
Worksheets
✕
Clear All
Sort by:
Relevance
Most recent
Most popular
Alphabetical A-Z
Alphabetical Z-A
All filters
95 results
Sort by:
Relevance
Most recent
Most popular
Alphabetical A-Z
Alphabetical Z-A
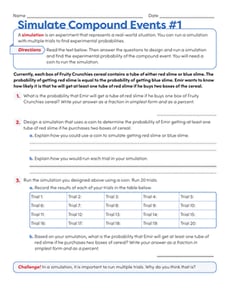
Simulate Compound Events #1
Worksheet
Simulate Compound Events #1
Seventh Grade
Data and Graphing
Practice designing a simulation for real-world compound events with this seventh-grade probability worksheet!
Worksheet
Simulate Compound Events #1
Worksheet
Simulate Compound Events #1
Practice designing a simulation for real-world compound events with this seventh-grade probability worksheet!
Seventh Grade
Data and Graphing
Worksheet
Graph Proportional Relationships #1
Worksheet
Graph Proportional Relationships #1
Eighth Grade
Ratios and Proportions
Help learners connect the constant of proportionality with the slope of a line in this one-page graphing worksheet!
Worksheet
Graph Proportional Relationships #1
Worksheet
Graph Proportional Relationships #1
Help learners connect the constant of proportionality with the slope of a line in this one-page graphing worksheet!
Eighth Grade
Ratios and Proportions
Worksheet
Creating Histograms From Frequency Tables
Worksheet
Creating Histograms From Frequency Tables
Sixth Grade
Data and Graphing
Practice using histograms to show different sets of data in this engaging sixth-grade worksheet!
Worksheet
Creating Histograms From Frequency Tables
Worksheet
Creating Histograms From Frequency Tables
Practice using histograms to show different sets of data in this engaging sixth-grade worksheet!
Sixth Grade
Data and Graphing
Worksheet
Comparing Pictographs: Football Time
Worksheet
Comparing Pictographs: Football Time
Third Grade
Data and Graphing
In this math worksheet, kids compare two pictographs that record the number of footballs kicked and the number of footballs thrown on the field.
Worksheet
Comparing Pictographs: Football Time
Worksheet
Comparing Pictographs: Football Time
In this math worksheet, kids compare two pictographs that record the number of footballs kicked and the number of footballs thrown on the field.
Third Grade
Data and Graphing
Worksheet
Sink the Ship: Coordinate Plane Activity
Worksheet
Sink the Ship: Coordinate Plane Activity
Sixth Grade
Data and Graphing
In this printable two-player game, learners practice graphing points in four quadrants of the coordinate plane and calling out ordered pairs.
Worksheet
Sink the Ship: Coordinate Plane Activity
Worksheet
Sink the Ship: Coordinate Plane Activity
In this printable two-player game, learners practice graphing points in four quadrants of the coordinate plane and calling out ordered pairs.
Sixth Grade
Data and Graphing
Worksheet
1
2
3
4