SKIP TO CONTENT
Worksheet Generator
Subjects
Grades
Worksheets
Games
Build a Worksheet
More Resources
Roly Recommends
Reading Month
Subjects
Grades
Worksheets
Games
Build a Worksheet
More Resources
Roly Recommends
Reading Month
All Subjects
Math
Data and Graphing
Subtopics:
Collecting and Organizing Data
Picture Graphs
Bar Graphs
Line Plots
Coordinate Plane
Box Plots
Histograms
Scatter Plots
Show Less
Filters
Search for: daily, practice, grade, 1, weeks, 1, 12
✕
Math
✕
Worksheets
✕
Subjects
Math
English Language Arts
Science
Social Studies
Foreign Language
Grade Level
Pre-K
K
1st
2nd
3rd
4th
5th
6th
7th
8th
Early Childhood
Elementary School
Middle School
Resource Type
Worksheets
Games
Lesson Plans
Interactive Worksheets
Workbooks
Activities
Exercises
Offline Games
Guided Lessons
Teacher Resources
Occasion
St. Patrick's Day
Easter
Earth Day
Summer
Back to School
Halloween
Winter
Holidays
Christmas
Valentine's Day
Common Core
Yes
Game Type
Printable Board Games
Travel Games
Arts & Crafts
Arts & Crafts
Paper & Glue Crafts
See More
Clear All
View 339 results
Showing Results for daily practice grade 1 weeks 1 12 : Page 4
339 results
Search for: daily, practice, grade, 1, weeks, 1, 12
✕
Math
✕
Worksheets
✕
Clear All
Sort by:
Relevance
Most recent
Most popular
Alphabetical A-Z
Alphabetical Z-A
All filters
339 results
Sort by:
Relevance
Most recent
Most popular
Alphabetical A-Z
Alphabetical Z-A
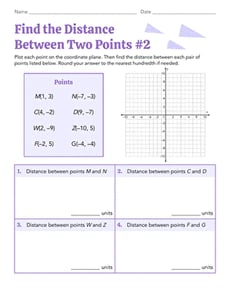
Find the Distance Between Two Points #2
Worksheet
Find the Distance Between Two Points #2
Eighth Grade
Geometry
Test your geometry skills and use the Pythagorean theorem in this eighth-grade worksheet!
Worksheet
Find the Distance Between Two Points #2
Worksheet
Find the Distance Between Two Points #2
Test your geometry skills and use the Pythagorean theorem in this eighth-grade worksheet!
Eighth Grade
Geometry
Worksheet
Using a Chart: Do Your Chores!
Worksheet
Using a Chart: Do Your Chores!
Third Grade
Data and Graphing
Kids completing this third grade math worksheet use a chart to compare data and solve addition problems.
Worksheet
Using a Chart: Do Your Chores!
Worksheet
Using a Chart: Do Your Chores!
Kids completing this third grade math worksheet use a chart to compare data and solve addition problems.
Third Grade
Data and Graphing
Worksheet
Comparing Pictographs: Taxi, Taxi
Worksheet
Comparing Pictographs: Taxi, Taxi
Third Grade
Addition
In this 3rd grade math worksheet, kids analyze and compare data in two pictographs in order to answer a set of word problems.
Worksheet
Comparing Pictographs: Taxi, Taxi
Worksheet
Comparing Pictographs: Taxi, Taxi
In this 3rd grade math worksheet, kids analyze and compare data in two pictographs in order to answer a set of word problems.
Third Grade
Addition
Worksheet
Creating Box Plots
Worksheet
Creating Box Plots
Sixth Grade
Data and Graphing
Learn to draw your own box plots to show data in this informative sixth-grade worksheet!
Worksheet
Creating Box Plots
Worksheet
Creating Box Plots
Learn to draw your own box plots to show data in this informative sixth-grade worksheet!
Sixth Grade
Data and Graphing
Worksheet
Describing Distributions in Dot Plots
Worksheet
Describing Distributions in Dot Plots
Sixth Grade
Data and Graphing
Students explore distributions in dot plots with this sixth-grade statistics worksheet!
Worksheet
Describing Distributions in Dot Plots
Worksheet
Describing Distributions in Dot Plots
Students explore distributions in dot plots with this sixth-grade statistics worksheet!
Sixth Grade
Data and Graphing
Worksheet
From Dot Plots to Histograms
Worksheet
From Dot Plots to Histograms
Sixth Grade
Data and Graphing
Discover different ways to display data in this delightful sixth-grade worksheet!
Worksheet
From Dot Plots to Histograms
Worksheet
From Dot Plots to Histograms
Discover different ways to display data in this delightful sixth-grade worksheet!
Sixth Grade
Data and Graphing
Worksheet
Measurement & Data Review
Worksheet
Measurement & Data Review
Fifth Grade
Fractions
Assess your students’ knowledge of fifth grade data and measurement concepts.
Worksheet
Measurement & Data Review
Worksheet
Measurement & Data Review
Assess your students’ knowledge of fifth grade data and measurement concepts.
Fifth Grade
Fractions
Worksheet
Graph the Critters
Worksheet
Graph the Critters
Second Grade
Data and Graphing
Give your second grader a fun way to practice basic arithmetic, and to practice making a graph with given information.
Worksheet
Graph the Critters
Worksheet
Graph the Critters
Give your second grader a fun way to practice basic arithmetic, and to practice making a graph with given information.
Second Grade
Data and Graphing
Worksheet
Interpreting Line Plots with Fractional Units
Worksheet
Interpreting Line Plots with Fractional Units
Third Grade
Data and Graphing
In this third grade worksheet, kids will interpret a line plot that includes fractional units.
Worksheet
Interpreting Line Plots with Fractional Units
Worksheet
Interpreting Line Plots with Fractional Units
In this third grade worksheet, kids will interpret a line plot that includes fractional units.
Third Grade
Data and Graphing
Worksheet
Constructing Scatter Plots
Worksheet
Constructing Scatter Plots
Eighth Grade
Data and Graphing
Get students creating scatter plots using real-world data sets with this eighth-grade math worksheet!
Worksheet
Constructing Scatter Plots
Worksheet
Constructing Scatter Plots
Get students creating scatter plots using real-world data sets with this eighth-grade math worksheet!
Eighth Grade
Data and Graphing
Worksheet
Making a Graph: Andy's Safari
Worksheet
Making a Graph: Andy's Safari
Second Grade
Data and Graphing
Give your second grader a fun way to practice reading and using graphs, as well as practice basic arithmetic with this graphing worksheet.
Worksheet
Making a Graph: Andy's Safari
Worksheet
Making a Graph: Andy's Safari
Give your second grader a fun way to practice reading and using graphs, as well as practice basic arithmetic with this graphing worksheet.
Second Grade
Data and Graphing
Worksheet
Interpreting Two-Way Frequency Tables
Worksheet
Interpreting Two-Way Frequency Tables
Eighth Grade
Data and Graphing
Students analyze two-way frequency tables in the context of relatable scenarios in this eighth-grade math worksheet!
Worksheet
Interpreting Two-Way Frequency Tables
Worksheet
Interpreting Two-Way Frequency Tables
Students analyze two-way frequency tables in the context of relatable scenarios in this eighth-grade math worksheet!
Eighth Grade
Data and Graphing
Worksheet
Ski Trail Tracker #8
Worksheet
Ski Trail Tracker #8
Fifth Grade
Data and Graphing
Show your fifth grader how to practice geometry and division sporty style with this fun math worksheet!
Worksheet
Ski Trail Tracker #8
Worksheet
Ski Trail Tracker #8
Show your fifth grader how to practice geometry and division sporty style with this fun math worksheet!
Fifth Grade
Data and Graphing
Worksheet
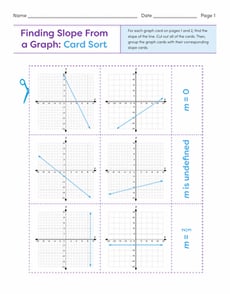
Finding Slope From a Graph: Card Sort
Worksheet
Finding Slope From a Graph: Card Sort
Eighth Grade
Algebra
Use this hands-on card sort activity to give students practice determining slope from a graph!
Worksheet
Finding Slope From a Graph: Card Sort
Worksheet
Finding Slope From a Graph: Card Sort
Use this hands-on card sort activity to give students practice determining slope from a graph!
Eighth Grade
Algebra
Worksheet
Let's Draw: Create Line Plots
Worksheet
Let's Draw: Create Line Plots
Sixth Grade
Data and Graphing
Use data from a farmers' market to create your own line plots in this sixth-grade worksheet!
Worksheet
Let's Draw: Create Line Plots
Worksheet
Let's Draw: Create Line Plots
Use data from a farmers' market to create your own line plots in this sixth-grade worksheet!
Sixth Grade
Data and Graphing
Worksheet
Experimental Probability Models
Worksheet
Experimental Probability Models
Seventh Grade
Data and Graphing
Use this seventh-grade math worksheet to introduce students to the concept of experimental probability models.
Worksheet
Experimental Probability Models
Worksheet
Experimental Probability Models
Use this seventh-grade math worksheet to introduce students to the concept of experimental probability models.
Seventh Grade
Data and Graphing
Worksheet
Mean Absolute Deviation
Worksheet
Mean Absolute Deviation
Sixth Grade
Data and Graphing
Students calculate the mean absolute deviation of data sets in this sixth-grade date and graphing worksheet.
Worksheet
Mean Absolute Deviation
Worksheet
Mean Absolute Deviation
Students calculate the mean absolute deviation of data sets in this sixth-grade date and graphing worksheet.
Sixth Grade
Data and Graphing
Worksheet
Foot Length: Create a Line Plot with Fractional Units
Worksheet
Foot Length: Create a Line Plot with Fractional Units
Fourth Grade
Data and Graphing
This worksheet challenges third graders to interpret the data and create a line plot with fractions, a key skill for fourth grade math.
Worksheet
Foot Length: Create a Line Plot with Fractional Units
Worksheet
Foot Length: Create a Line Plot with Fractional Units
This worksheet challenges third graders to interpret the data and create a line plot with fractions, a key skill for fourth grade math.
Fourth Grade
Data and Graphing
Worksheet
Understanding Charts: Muscleville Medals!
Worksheet
Understanding Charts: Muscleville Medals!
Third Grade
Data and Graphing
Looking for a worksheet to practice your third grader's chart reading skills? This printable works with interpreting charts.
Worksheet
Understanding Charts: Muscleville Medals!
Worksheet
Understanding Charts: Muscleville Medals!
Looking for a worksheet to practice your third grader's chart reading skills? This printable works with interpreting charts.
Third Grade
Data and Graphing
Worksheet
Histograms
Worksheet
Histograms
Sixth Grade
Data and Graphing
In this sixth-grade data and graphing worksheet, students will complete histograms from given data sets and frequency tables.
Worksheet
Histograms
Worksheet
Histograms
In this sixth-grade data and graphing worksheet, students will complete histograms from given data sets and frequency tables.
Sixth Grade
Data and Graphing
Worksheet
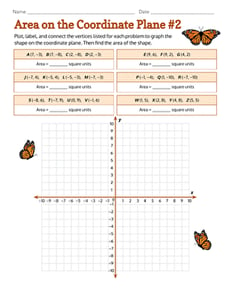
Area on the Coordinate Plane #2
Worksheet
Area on the Coordinate Plane #2
Sixth Grade
Geometry
Get more practice plotting and calculating the area of shapes on the coordinate plane with this geometry worksheet!
Worksheet
Area on the Coordinate Plane #2
Worksheet
Area on the Coordinate Plane #2
Get more practice plotting and calculating the area of shapes on the coordinate plane with this geometry worksheet!
Sixth Grade
Geometry
Worksheet
Sample Spaces of Compound Events
Worksheet
Sample Spaces of Compound Events
Seventh Grade
Data and Graphing
This seventh-grade math worksheet guides students through the process of finding the sample space of compound events.
Worksheet
Sample Spaces of Compound Events
Worksheet
Sample Spaces of Compound Events
This seventh-grade math worksheet guides students through the process of finding the sample space of compound events.
Seventh Grade
Data and Graphing
Worksheet
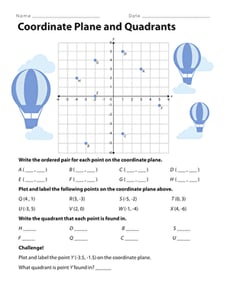
Coordinate Plane and Quadrants
Worksheet
Coordinate Plane and Quadrants
Sixth Grade
Data and Graphing
Expand your knowledge of the coordinate plane to all four quadrants! Practice plotting points and writing ordered pairs.
Worksheet
Coordinate Plane and Quadrants
Worksheet
Coordinate Plane and Quadrants
Expand your knowledge of the coordinate plane to all four quadrants! Practice plotting points and writing ordered pairs.
Sixth Grade
Data and Graphing
Worksheet
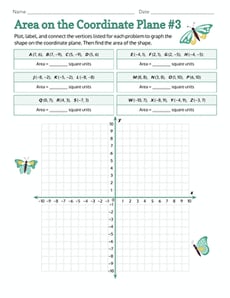
Area on the Coordinate Plane #3
Worksheet
Area on the Coordinate Plane #3
Sixth Grade
Geometry
Get even more practice finding the area of shapes on the coordinate plane with this geometry worksheet!
Worksheet
Area on the Coordinate Plane #3
Worksheet
Area on the Coordinate Plane #3
Get even more practice finding the area of shapes on the coordinate plane with this geometry worksheet!
Sixth Grade
Geometry
Worksheet
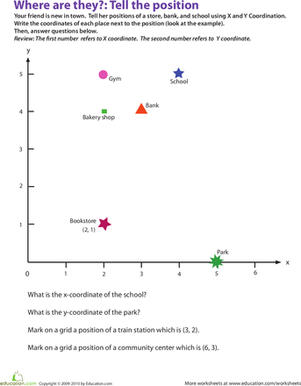
Where Are They? Find Coordinates
Worksheet
Where Are They? Find Coordinates
Fourth Grade
Data and Graphing
Give your fourth grader some practice with graphing and coordinates as she determines each location's coordinates on this printable.
Worksheet
Where Are They? Find Coordinates
Worksheet
Where Are They? Find Coordinates
Give your fourth grader some practice with graphing and coordinates as she determines each location's coordinates on this printable.
Fourth Grade
Data and Graphing
Worksheet
Reading Pictographs: Drink Your Milk!
Worksheet
Reading Pictographs: Drink Your Milk!
Third Grade
Data and Graphing
Can your child help Tommy figure out how much milk he drinks? As she does, she'll learn how to read and interpret data in graphs and practice multiplication.
Worksheet
Reading Pictographs: Drink Your Milk!
Worksheet
Reading Pictographs: Drink Your Milk!
Can your child help Tommy figure out how much milk he drinks? As she does, she'll learn how to read and interpret data in graphs and practice multiplication.
Third Grade
Data and Graphing
Worksheet
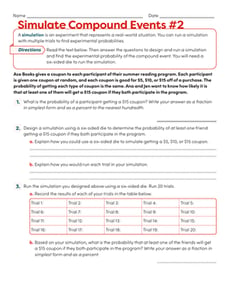
Simulate Compound Events #2
Worksheet
Simulate Compound Events #2
Seventh Grade
Data and Graphing
Give students additional practice designing and running a simulation to determine the probability of real-world compound events!
Worksheet
Simulate Compound Events #2
Worksheet
Simulate Compound Events #2
Give students additional practice designing and running a simulation to determine the probability of real-world compound events!
Seventh Grade
Data and Graphing
Worksheet
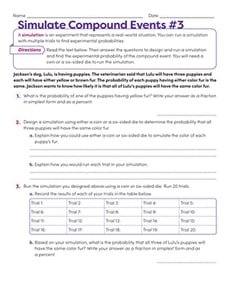
Simulate Compound Events #3
Worksheet
Simulate Compound Events #3
Seventh Grade
Data and Graphing
Give students more practice designing and running a simulation to determine the probability of real-world compound events!
Worksheet
Simulate Compound Events #3
Worksheet
Simulate Compound Events #3
Give students more practice designing and running a simulation to determine the probability of real-world compound events!
Seventh Grade
Data and Graphing
Worksheet
Interpreting Slopes and y-Intercepts of Lines of Best Fit
Worksheet
Interpreting Slopes and y-Intercepts of Lines of Best Fit
Eighth Grade
Algebra
Students interpret slopes and
y
-intercepts of lines of best fit based on real-world scenarios in this eighth-grade worksheet!
Worksheet
Interpreting Slopes and y-Intercepts of Lines of Best Fit
Worksheet
Interpreting Slopes and y-Intercepts of Lines of Best Fit
Students interpret slopes and
y
-intercepts of lines of best fit based on real-world scenarios in this eighth-grade worksheet!
Eighth Grade
Algebra
Worksheet
Do a Survey! Favorite Veggies
Worksheet
Do a Survey! Favorite Veggies
Second Grade
Data and Graphing
Give your second grader some practice working with data with this fun-to-complete favorite veggie survey.
Worksheet
Do a Survey! Favorite Veggies
Worksheet
Do a Survey! Favorite Veggies
Give your second grader some practice working with data with this fun-to-complete favorite veggie survey.
Second Grade
Data and Graphing
Worksheet
1
2
3
4
5
…
12