SKIP TO CONTENT
Worksheet Generator
Subjects
Grades
Worksheets
Games
Build a Worksheet
More Resources
Roly Recommends
Subjects
Grades
Worksheets
Games
Build a Worksheet
More Resources
Roly Recommends
Filters
Search for: results, in, interpreting, data
✕
Worksheets
✕
Subjects
Math
English Language Arts
Science
Social Studies
Grade Level
Pre-K
K
1st
2nd
3rd
4th
5th
6th
7th
8th
Early Childhood
Elementary School
Middle School
Resource Type
Worksheets
Games
Lesson Plans
Interactive Worksheets
Workbooks
Activities
Exercises
Songs
Offline Games
Guided Lessons
Teacher Resources
Occasion
Women's History Month
St. Patrick's Day
Spring
Easter
Summer
Back to School
Fall
Halloween
Winter
Holidays
Christmas
Martin Luther King Jr. Day
Valentine's Day
Black History Month
See more
Common Core
Yes
No
Roly Recommends
Social Emotional Learning
Game Type
Memory Games
Printable Board Games
Puzzles & Sudoku
Travel Games
Word Puzzles
Arts & Crafts
Arts & Crafts
Paper & Glue Crafts
Coloring
Yes
See More
Clear All
View 467 results
Showing Results for results in interpreting data : Page 2
467 results
Search for: results, in, interpreting, data
✕
Worksheets
✕
Clear All
Sort by:
Relevance
Most recent
Most popular
Alphabetical A-Z
Alphabetical Z-A
All filters
467 results
Sort by:
Relevance
Most recent
Most popular
Alphabetical A-Z
Alphabetical Z-A
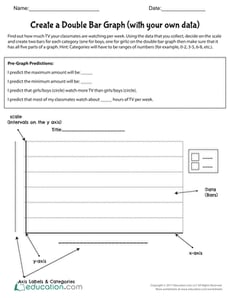
Create a Double Bar Graph (with your own data)
Worksheet
Create a Double Bar Graph (with your own data)
Fifth Grade
Data and Graphing
Students will collect data, create a double bar graph, and interpret the graph by responding to prompts that will get them thinking critically.
Worksheet
Create a Double Bar Graph (with your own data)
Worksheet
Create a Double Bar Graph (with your own data)
Students will collect data, create a double bar graph, and interpret the graph by responding to prompts that will get them thinking critically.
Fifth Grade
Data and Graphing
Worksheet
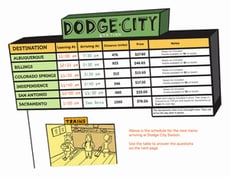
Data Chart: The Dodge City Train Station
Worksheet
Data Chart: The Dodge City Train Station
Fourth Grade
Measurement
Give your fourth-grader some real-world chart-reading practice with a familiar data chart: a train schedule!
Worksheet
Data Chart: The Dodge City Train Station
Worksheet
Data Chart: The Dodge City Train Station
Give your fourth-grader some real-world chart-reading practice with a familiar data chart: a train schedule!
Fourth Grade
Measurement
Worksheet
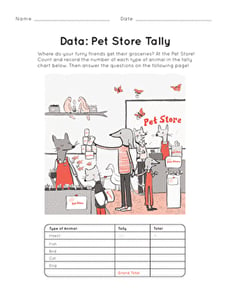
Doing Data: The Pet Store Tally
Worksheet
Doing Data: The Pet Store Tally
First Grade
Data and Graphing
Not only is this filled with cute animal images, but it gives your first grader just the practice they need to get comfortable tallying up sets of data.
Worksheet
Doing Data: The Pet Store Tally
Worksheet
Doing Data: The Pet Store Tally
Not only is this filled with cute animal images, but it gives your first grader just the practice they need to get comfortable tallying up sets of data.
First Grade
Data and Graphing
Worksheet
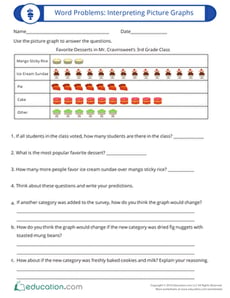
Word Problems: Interpreting Picture Graphs
Worksheet
Word Problems: Interpreting Picture Graphs
Third Grade
Data and Graphing
Students will cultivate the skills of reading, interpreting and analyzing picture graphs with this word problem that activates higher order thinking.
Worksheet
Word Problems: Interpreting Picture Graphs
Worksheet
Word Problems: Interpreting Picture Graphs
Students will cultivate the skills of reading, interpreting and analyzing picture graphs with this word problem that activates higher order thinking.
Third Grade
Data and Graphing
Worksheet
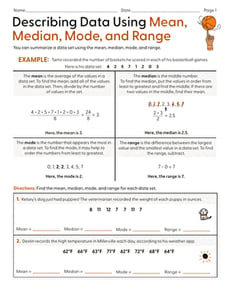
Describing Data Using Mean, Median, Mode, and Range
Worksheet
Describing Data Using Mean, Median, Mode, and Range
Sixth Grade
Statistics
Students describe data using measures of center and a measure of variability in this statistics worksheet for middle grades!
Worksheet
Describing Data Using Mean, Median, Mode, and Range
Worksheet
Describing Data Using Mean, Median, Mode, and Range
Students describe data using measures of center and a measure of variability in this statistics worksheet for middle grades!
Sixth Grade
Statistics
Worksheet
Create a Line Plot with Data Provided
Worksheet
Create a Line Plot with Data Provided
Third Grade
Data and Graphing
Use the data provided to have your students create a line plot that reflects how much TV watched per week for one third grade class.
Worksheet
Create a Line Plot with Data Provided
Worksheet
Create a Line Plot with Data Provided
Use the data provided to have your students create a line plot that reflects how much TV watched per week for one third grade class.
Third Grade
Data and Graphing
Worksheet
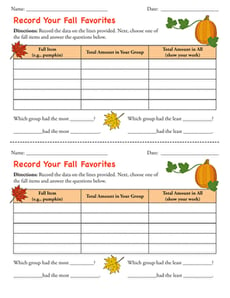
Record Your Fall Favorites
Worksheet
Record Your Fall Favorites
Second Grade
Data and Graphing
Use this template alongside the engaging lesson, “Let’s Graph Our Fall Favorites” to support kids in interpreting data.
Worksheet
Record Your Fall Favorites
Worksheet
Record Your Fall Favorites
Use this template alongside the engaging lesson, “Let’s Graph Our Fall Favorites” to support kids in interpreting data.
Second Grade
Data and Graphing
Worksheet
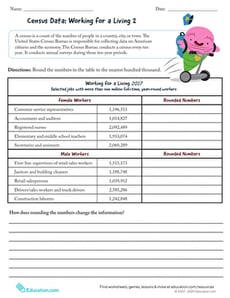
Census Data: Working for a Living 2
Worksheet
Census Data: Working for a Living 2
Fourth Grade
Place Value
Use the worksheet Census Data 2017: Working for a Living 2 to help learners round the total number of workers to the nearest hundred millions place.
Worksheet
Census Data: Working for a Living 2
Worksheet
Census Data: Working for a Living 2
Use the worksheet Census Data 2017: Working for a Living 2 to help learners round the total number of workers to the nearest hundred millions place.
Fourth Grade
Place Value
Worksheet
Pet Survey
Worksheet
Pet Survey
First Grade
Data and Graphing
Have your students survey one another about pet preferences using this interactive activity designed to practice representing and interpreting data.
Worksheet
Pet Survey
Worksheet
Pet Survey
Have your students survey one another about pet preferences using this interactive activity designed to practice representing and interpreting data.
First Grade
Data and Graphing
Worksheet
Line Plot Practice
Worksheet
Line Plot Practice
Second Grade
Data and Graphing
Use this worksheet to get your mathematicians comfortable and confident creating and interpreting line plots from a given set of data.
Worksheet
Line Plot Practice
Worksheet
Line Plot Practice
Use this worksheet to get your mathematicians comfortable and confident creating and interpreting line plots from a given set of data.
Second Grade
Data and Graphing
Worksheet
Reading Pictographs: Building a New Town
Worksheet
Reading Pictographs: Building a New Town
Third Grade
Data and Graphing
In this 3rd grade math worksheet, kids practice interpreting graph data and using information in a pictograph to answer word problems.
Worksheet
Reading Pictographs: Building a New Town
Worksheet
Reading Pictographs: Building a New Town
In this 3rd grade math worksheet, kids practice interpreting graph data and using information in a pictograph to answer word problems.
Third Grade
Data and Graphing
Worksheet
2017 Census Data: Working for a Living 3
Worksheet
2017 Census Data: Working for a Living 3
Addition
Use the worksheet 2017 Census Data: Working for a Living 3 to help your fourth or fifth graders evaluate a bar graph with numbers represented as decimals. They will use the graph to compare and add the decimal numbers.
Worksheet
2017 Census Data: Working for a Living 3
Worksheet
2017 Census Data: Working for a Living 3
Use the worksheet 2017 Census Data: Working for a Living 3 to help your fourth or fifth graders evaluate a bar graph with numbers represented as decimals. They will use the graph to compare and add the decimal numbers.
Addition
Worksheet
Go Runners! Practice Reading a Bar Graph
Worksheet
Go Runners! Practice Reading a Bar Graph
Third Grade
Data and Graphing
Your child will practice reading and interpreting a bar graph and using its data to answer a set of questions in this 3rd grade math worksheet.
Worksheet
Go Runners! Practice Reading a Bar Graph
Worksheet
Go Runners! Practice Reading a Bar Graph
Your child will practice reading and interpreting a bar graph and using its data to answer a set of questions in this 3rd grade math worksheet.
Third Grade
Data and Graphing
Worksheet
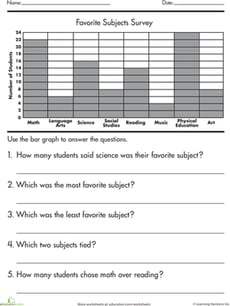
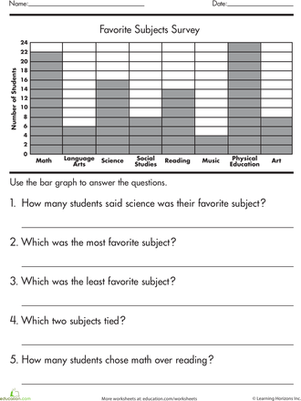
Graphing Survey Data
Worksheet
Graphing Survey Data
Second Grade
Data and Graphing
If your second grader is stumped by bar graphs, clear up the confusion with this worksheet that helps kids learn how to read and interpret a bar graph.
Worksheet
Graphing Survey Data
Worksheet
Graphing Survey Data
If your second grader is stumped by bar graphs, clear up the confusion with this worksheet that helps kids learn how to read and interpret a bar graph.
Second Grade
Data and Graphing
Worksheet
Reading Pictographs: Going to the Theater
Worksheet
Reading Pictographs: Going to the Theater
Third Grade
Data and Graphing
In this 3rd grade math worksheet, kids practice interpreting graph data as they use the information in a pictograph to answer a set of questions.
Worksheet
Reading Pictographs: Going to the Theater
Worksheet
Reading Pictographs: Going to the Theater
In this 3rd grade math worksheet, kids practice interpreting graph data as they use the information in a pictograph to answer a set of questions.
Third Grade
Data and Graphing
Worksheet
Graphing Data: Colors
Worksheet
Graphing Data: Colors
Second Grade
Data and Graphing
Help the concept of graphing really sink in by challenging your second grader to graph kids' favorite colors using a table, tally mark table, and grid.
Worksheet
Graphing Data: Colors
Worksheet
Graphing Data: Colors
Help the concept of graphing really sink in by challenging your second grader to graph kids' favorite colors using a table, tally mark table, and grid.
Second Grade
Data and Graphing
Worksheet
Poll Results
Worksheet
Poll Results
Fourth Grade
Imagine you were the U.S. president and decide where to stand on controversial issues. You can't please all the people all the time!
Worksheet
Poll Results
Worksheet
Poll Results
Imagine you were the U.S. president and decide where to stand on controversial issues. You can't please all the people all the time!
Fourth Grade
Worksheet
Drawing Inferences Using Data
Worksheet
Drawing Inferences Using Data
Seventh Grade
Data and Graphing
Students compare different survey methods to make inferences about how much time students at a school spend playing video games in this seventh-grade math worksheet.
Worksheet
Drawing Inferences Using Data
Worksheet
Drawing Inferences Using Data
Students compare different survey methods to make inferences about how much time students at a school spend playing video games in this seventh-grade math worksheet.
Seventh Grade
Data and Graphing
Worksheet
Practice Finding Median
Worksheet
Practice Finding Median
Sixth Grade
Statistics
Practice finding the median of a data set with this data worksheet!
Worksheet
Practice Finding Median
Worksheet
Practice Finding Median
Practice finding the median of a data set with this data worksheet!
Sixth Grade
Statistics
Worksheet
Creating a Bar Graph: Favorite Picnic Spots
Worksheet
Creating a Bar Graph: Favorite Picnic Spots
Second Grade
Data and Graphing
Learners practice charting and graphing data in this hands-on worksheet.
Worksheet
Creating a Bar Graph: Favorite Picnic Spots
Worksheet
Creating a Bar Graph: Favorite Picnic Spots
Learners practice charting and graphing data in this hands-on worksheet.
Second Grade
Data and Graphing
Worksheet
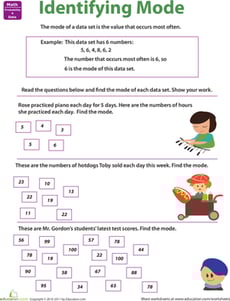
Doing Data: Finding Mode #2
Worksheet
Doing Data: Finding Mode #2
Second Grade
With three different ways to find averages, your second grader may be a little overwhelmed with math. Making finding modes easier with this worksheet.
Worksheet
Doing Data: Finding Mode #2
Worksheet
Doing Data: Finding Mode #2
With three different ways to find averages, your second grader may be a little overwhelmed with math. Making finding modes easier with this worksheet.
Second Grade
Worksheet
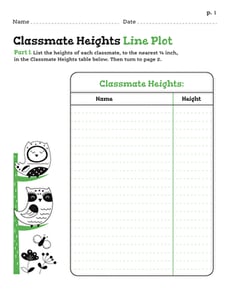
Classmate Heights Line Plot
Worksheet
Classmate Heights Line Plot
Second Grade
Fractions
Learners will practice collecting data and creating a data line plot in this two-page worksheet.
Worksheet
Classmate Heights Line Plot
Worksheet
Classmate Heights Line Plot
Learners will practice collecting data and creating a data line plot in this two-page worksheet.
Second Grade
Fractions
Worksheet
Create a Line Plot (With Your Own Data!)
Worksheet
Create a Line Plot (With Your Own Data!)
Second Grade
Data and Graphing
Invite students to become researchers with this open-ended line plot template!
Worksheet
Create a Line Plot (With Your Own Data!)
Worksheet
Create a Line Plot (With Your Own Data!)
Invite students to become researchers with this open-ended line plot template!
Second Grade
Data and Graphing
Worksheet
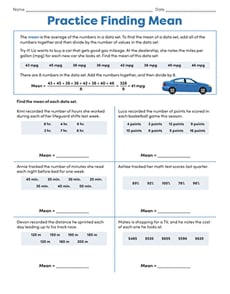
Practice Finding Mean
Interactive Worksheet
Practice Finding Mean
Sixth Grade
Statistics
Give learners practice finding the mean of a data set with this sixth-grade data and statistics worksheet!
Interactive Worksheet
Practice Finding Mean
Interactive Worksheet
Practice Finding Mean
Give learners practice finding the mean of a data set with this sixth-grade data and statistics worksheet!
Sixth Grade
Statistics
Interactive Worksheet
From Dot Plots to Histograms
Worksheet
From Dot Plots to Histograms
Sixth Grade
Data and Graphing
Discover different ways to display data in this delightful sixth-grade worksheet!
Worksheet
From Dot Plots to Histograms
Worksheet
From Dot Plots to Histograms
Discover different ways to display data in this delightful sixth-grade worksheet!
Sixth Grade
Data and Graphing
Worksheet
Box Plots #1
Interactive Worksheet
Box Plots #1
Sixth Grade
Data and Graphing
Practice interpreting box plots with this sixth-grade worksheet!
Interactive Worksheet
Box Plots #1
Interactive Worksheet
Box Plots #1
Practice interpreting box plots with this sixth-grade worksheet!
Sixth Grade
Data and Graphing
Interactive Worksheet
Practice Finding Range
Worksheet
Practice Finding Range
Sixth Grade
Data and Graphing
Give your students practice finding the range of a data set with this sixth-grade data and graphing worksheet!
Worksheet
Practice Finding Range
Worksheet
Practice Finding Range
Give your students practice finding the range of a data set with this sixth-grade data and graphing worksheet!
Sixth Grade
Data and Graphing
Worksheet
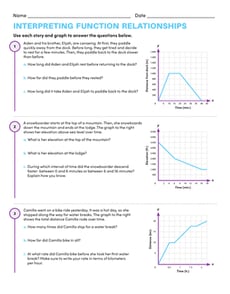
Interpreting Function Relationships
Worksheet
Interpreting Function Relationships
Eighth Grade
Algebra
In this eighth-grade algebra worksheet, students use brief stories and graphs to answer questions about real-world function relationships.
Worksheet
Interpreting Function Relationships
Worksheet
Interpreting Function Relationships
In this eighth-grade algebra worksheet, students use brief stories and graphs to answer questions about real-world function relationships.
Eighth Grade
Algebra
Worksheet
Interpreting Two-Way Frequency Tables
Worksheet
Interpreting Two-Way Frequency Tables
Eighth Grade
Data and Graphing
Students analyze two-way frequency tables in the context of relatable scenarios in this eighth-grade math worksheet!
Worksheet
Interpreting Two-Way Frequency Tables
Worksheet
Interpreting Two-Way Frequency Tables
Students analyze two-way frequency tables in the context of relatable scenarios in this eighth-grade math worksheet!
Eighth Grade
Data and Graphing
Worksheet
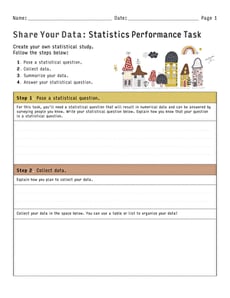
Share Your Data: Statistics Performance Task
Worksheet
Share Your Data: Statistics Performance Task
Sixth Grade
Data and Graphing
Create your own statistical study with this open-ended math worksheet for sixth graders!
Worksheet
Share Your Data: Statistics Performance Task
Worksheet
Share Your Data: Statistics Performance Task
Create your own statistical study with this open-ended math worksheet for sixth graders!
Sixth Grade
Data and Graphing
Worksheet
1
2
3
4
…
16