SKIP TO CONTENT
Worksheet Generator
Subjects
Grades
Worksheets
Games
Build a Worksheet
More Resources
Roly Recommends
Subjects
Grades
Worksheets
Games
Build a Worksheet
More Resources
Roly Recommends
All Subjects
Math
Data and Graphing
Subtopics:
Collecting and Organizing Data
Picture Graphs
Bar Graphs
Line Plots
Coordinate Plane
Box Plots
Histograms
Show Less
Filters
Search for: number, sense, 3
✕
Math
✕
Subjects
Math
English Language Arts
Science
Social Studies
Foreign Language
Grade Level
Pre-K
K
1st
2nd
3rd
4th
5th
6th
7th
8th
Early Childhood
Elementary School
Middle School
Resource Type
Worksheets
Games
Lesson Plans
Interactive Worksheets
Workbooks
Activities
Exercises
Offline Games
Guided Lessons
Occasion
Birthdays
St. Patrick's Day
Summer
Halloween
Winter
Holidays
Valentine's Day
Common Core
Yes
Game Type
Ball Games
Arts & Crafts
Arts & Crafts
Paper & Glue Crafts
Construction & Sculpture
English Language Support
Yes
See More
Clear All
View 163 results
Showing Results for number sense 3 : Page 5
163 results
Search for: number, sense, 3
✕
Math
✕
Sort by:
Relevance
Most recent
Most popular
Alphabetical A-Z
Alphabetical Z-A
All filters
163 results
Sort by:
Relevance
Most recent
Most popular
Alphabetical A-Z
Alphabetical Z-A
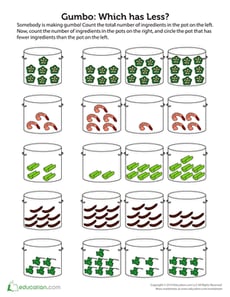
Gumbo: Which has Less?
Worksheet
Gumbo: Which has Less?
Kindergarten
Numbers and Counting
Help your child learn the ingredients for gumbo and compare amounts with this delectable worksheet.
Worksheet
Gumbo: Which has Less?
Worksheet
Gumbo: Which has Less?
Help your child learn the ingredients for gumbo and compare amounts with this delectable worksheet.
Kindergarten
Numbers and Counting
Worksheet
Practice Reading Venn Diagrams #2: In the Orchestra
Worksheet
Practice Reading Venn Diagrams #2: In the Orchestra
Second Grade
Data and Graphing
Kids practice reading a Venn diagram about instruments in an orchestra and answering questions about it in this 2nd grade math worksheet.
Worksheet
Practice Reading Venn Diagrams #2: In the Orchestra
Worksheet
Practice Reading Venn Diagrams #2: In the Orchestra
Kids practice reading a Venn diagram about instruments in an orchestra and answering questions about it in this 2nd grade math worksheet.
Second Grade
Data and Graphing
Worksheet
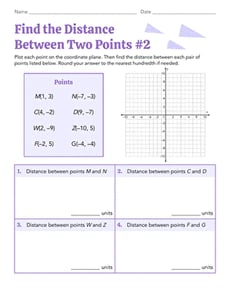
Find the Distance Between Two Points #2
Worksheet
Find the Distance Between Two Points #2
Eighth Grade
Geometry
Test your geometry skills and use the Pythagorean theorem in this eighth-grade worksheet!
Worksheet
Find the Distance Between Two Points #2
Worksheet
Find the Distance Between Two Points #2
Test your geometry skills and use the Pythagorean theorem in this eighth-grade worksheet!
Eighth Grade
Geometry
Worksheet
Let's Draw: Create Line Plots
Worksheet
Let's Draw: Create Line Plots
Sixth Grade
Data and Graphing
Use data from a farmers' market to create your own line plots in this sixth-grade worksheet!
Worksheet
Let's Draw: Create Line Plots
Worksheet
Let's Draw: Create Line Plots
Use data from a farmers' market to create your own line plots in this sixth-grade worksheet!
Sixth Grade
Data and Graphing
Worksheet
Bounce that Ball: Learn Math While Doing Sports
Activity
Bounce that Ball: Learn Math While Doing Sports
First Grade
Data and Graphing
Head out to the driveway, ball in hand, for a bouncing challenge. Then use those results to make a colorful graph that lets your child compare results.
Activity
Bounce that Ball: Learn Math While Doing Sports
Activity
Bounce that Ball: Learn Math While Doing Sports
Head out to the driveway, ball in hand, for a bouncing challenge. Then use those results to make a colorful graph that lets your child compare results.
First Grade
Data and Graphing
Activity
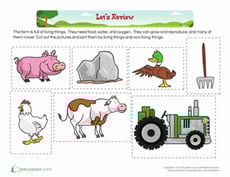
Sorting on the Farm
Worksheet
Sorting on the Farm
Kindergarten
Data and Graphing
This colorful cutting and sorting activity exercises your young one's little hand muscles and fine-tunes her sorting and categorizing skill set.
Worksheet
Sorting on the Farm
Worksheet
Sorting on the Farm
This colorful cutting and sorting activity exercises your young one's little hand muscles and fine-tunes her sorting and categorizing skill set.
Kindergarten
Data and Graphing
Worksheet
Mean Absolute Deviation
Worksheet
Mean Absolute Deviation
Sixth Grade
Data and Graphing
Students calculate the mean absolute deviation of data sets in this sixth-grade date and graphing worksheet.
Worksheet
Mean Absolute Deviation
Worksheet
Mean Absolute Deviation
Students calculate the mean absolute deviation of data sets in this sixth-grade date and graphing worksheet.
Sixth Grade
Data and Graphing
Worksheet
Comparing Weight
Worksheet
Comparing Weight
Kindergarten
Numbers and Counting
Take measurement learning to the next level with this comparing weight worksheet featuring common objects, and practice reading numbers.
Worksheet
Comparing Weight
Worksheet
Comparing Weight
Take measurement learning to the next level with this comparing weight worksheet featuring common objects, and practice reading numbers.
Kindergarten
Numbers and Counting
Worksheet
Make a Picture Graph
Worksheet
Make a Picture Graph
First Grade
Data and Graphing
In this math worksheet, children use picture graphs to tally up the total amounts of baked goods each party purchases.
Worksheet
Make a Picture Graph
Worksheet
Make a Picture Graph
In this math worksheet, children use picture graphs to tally up the total amounts of baked goods each party purchases.
First Grade
Data and Graphing
Worksheet
Garden Graphing: Count and Color!
Worksheet
Garden Graphing: Count and Color!
First Grade
Data and Graphing
Carrots, turnips and potatoes, oh my! Count how many of each vegetable our furry farmer picked and then fill in the graph for each vegetable.
Worksheet
Garden Graphing: Count and Color!
Worksheet
Garden Graphing: Count and Color!
Carrots, turnips and potatoes, oh my! Count how many of each vegetable our furry farmer picked and then fill in the graph for each vegetable.
First Grade
Data and Graphing
Worksheet
Find the Distance Between Two Points #1
Worksheet
Find the Distance Between Two Points #1
Eighth Grade
Geometry
Practice the Pythagorean theorem with this eighth-grade geometry worksheet!
Worksheet
Find the Distance Between Two Points #1
Worksheet
Find the Distance Between Two Points #1
Practice the Pythagorean theorem with this eighth-grade geometry worksheet!
Eighth Grade
Geometry
Worksheet
From Dot Plots to Histograms
Worksheet
From Dot Plots to Histograms
Sixth Grade
Data and Graphing
Discover different ways to display data in this delightful sixth-grade worksheet!
Worksheet
From Dot Plots to Histograms
Worksheet
From Dot Plots to Histograms
Discover different ways to display data in this delightful sixth-grade worksheet!
Sixth Grade
Data and Graphing
Worksheet
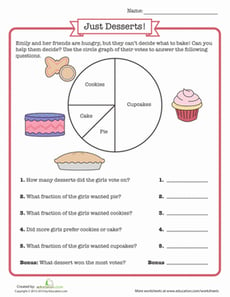
Circle Graph
Worksheet
Circle Graph
Third Grade
Fractions
Tickle your sweet tooth with this graphing worksheet! Your little baker will practice analyzing the data in a circle graph (or pie chart).
Worksheet
Circle Graph
Worksheet
Circle Graph
Tickle your sweet tooth with this graphing worksheet! Your little baker will practice analyzing the data in a circle graph (or pie chart).
Third Grade
Fractions
Worksheet
Probability Dice: Practice With Probability Models
Worksheet
Probability Dice: Practice With Probability Models
Seventh Grade
Data and Graphing
Probability can be as easy as rolling dice! What is the probability of rolling a 2? What about a 6? Practice calculating basic probability with this worksheet.
Worksheet
Probability Dice: Practice With Probability Models
Worksheet
Probability Dice: Practice With Probability Models
Probability can be as easy as rolling dice! What is the probability of rolling a 2? What about a 6? Practice calculating basic probability with this worksheet.
Seventh Grade
Data and Graphing
Worksheet
Create a Family Graph!
Activity
Create a Family Graph!
Third Grade
Data and Graphing
Create a graph based on the interests of family member's to see who has what in common. Your child will practice her math skills and get to know the family!
Activity
Create a Family Graph!
Activity
Create a Family Graph!
Create a graph based on the interests of family member's to see who has what in common. Your child will practice her math skills and get to know the family!
Third Grade
Data and Graphing
Activity
More or Less: Practice Comparing Numbers
Worksheet
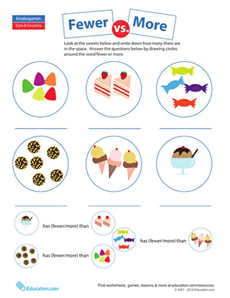
More or Less: Practice Comparing Numbers
Kindergarten
Numbers and Counting
Introduce your child to basic inequalities with this worksheet that challenges him to count up the objects in each group and decide which has fewer or more.
Worksheet
More or Less: Practice Comparing Numbers
Worksheet
More or Less: Practice Comparing Numbers
Introduce your child to basic inequalities with this worksheet that challenges him to count up the objects in each group and decide which has fewer or more.
Kindergarten
Numbers and Counting
Worksheet
Make a Venn Diagram: Gift Boxes
Worksheet
Make a Venn Diagram: Gift Boxes
Second Grade
Data and Graphing
Kids practice making a Venn diagram about kinds of gift wrap by sorting the gifts in their correct spaces in this 2nd grade math worksheet.
Worksheet
Make a Venn Diagram: Gift Boxes
Worksheet
Make a Venn Diagram: Gift Boxes
Kids practice making a Venn diagram about kinds of gift wrap by sorting the gifts in their correct spaces in this 2nd grade math worksheet.
Second Grade
Data and Graphing
Worksheet
Box Plots #1
Interactive Worksheet
Box Plots #1
Sixth Grade
Data and Graphing
Practice interpreting box plots with this sixth-grade worksheet!
Interactive Worksheet
Box Plots #1
Interactive Worksheet
Box Plots #1
Practice interpreting box plots with this sixth-grade worksheet!
Sixth Grade
Data and Graphing
Interactive Worksheet
Create Histograms From Data Sets
Worksheet
Create Histograms From Data Sets
Sixth Grade
Data and Graphing
Draw data to show a scientist’s findings in this practical worksheet!
Worksheet
Create Histograms From Data Sets
Worksheet
Create Histograms From Data Sets
Draw data to show a scientist’s findings in this practical worksheet!
Sixth Grade
Data and Graphing
Worksheet
Summer Bar Graph
Activity
Summer Bar Graph
First Grade
Data and Graphing
Draw some educational value out of a summer stocked full of adventures!
Activity
Summer Bar Graph
Activity
Summer Bar Graph
Draw some educational value out of a summer stocked full of adventures!
First Grade
Data and Graphing
Activity
Make an Edible Fruitloop Bracelet
Activity
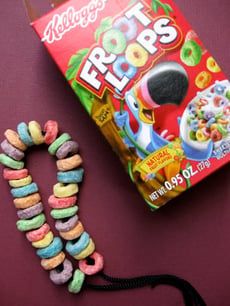
Make an Edible Fruitloop Bracelet
Kindergarten
Data and Graphing
Make an edible bracelet from Froot Loops and a shoelace! This Block Institute art activity will engage your special needs or mainstream child at snacktime.
Activity
Make an Edible Fruitloop Bracelet
Activity
Make an Edible Fruitloop Bracelet
Make an edible bracelet from Froot Loops and a shoelace! This Block Institute art activity will engage your special needs or mainstream child at snacktime.
Kindergarten
Data and Graphing
Activity
Make a Winter Weather Pictograph
Activity
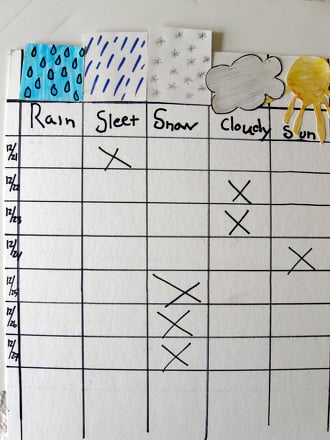
Make a Winter Weather Pictograph
First Grade
Data and Graphing
Encourage your kindergartener to investigate and chronicle the weather she observes during the coldest months of the year.
Activity
Make a Winter Weather Pictograph
Activity
Make a Winter Weather Pictograph
Encourage your kindergartener to investigate and chronicle the weather she observes during the coldest months of the year.
First Grade
Data and Graphing
Activity
All in Order
Activity
All in Order
Pre-K
Numbers and Counting
Help your preschooler grasp the concept of ordering and sequence while teaching him valuable vocabulary with simple activities around the house.
Activity
All in Order
Activity
All in Order
Help your preschooler grasp the concept of ordering and sequence while teaching him valuable vocabulary with simple activities around the house.
Pre-K
Numbers and Counting
Activity
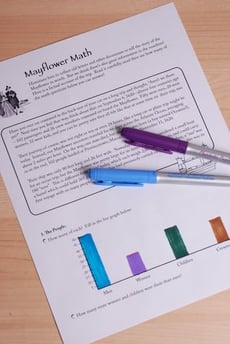
Mayflower Math
Activity
Mayflower Math
Fifth Grade
Data and Graphing
When you're studying the Mayflower, numbers can be an important part of the history...and a great chance to practice elementary math!
Activity
Mayflower Math
Activity
Mayflower Math
When you're studying the Mayflower, numbers can be an important part of the history...and a great chance to practice elementary math!
Fifth Grade
Data and Graphing
Activity
Draw a Birthday Bar Graph
Activity
Draw a Birthday Bar Graph
Third Grade
Data and Graphing
Liven up a lesson about graphing by helping your third grader compile a bar graph from his classmates' birthday data.
Activity
Draw a Birthday Bar Graph
Activity
Draw a Birthday Bar Graph
Liven up a lesson about graphing by helping your third grader compile a bar graph from his classmates' birthday data.
Third Grade
Data and Graphing
Activity
Track the Weather with Weather Charts
Activity
Track the Weather with Weather Charts
Third Grade
Measurement
Learn about the microclimate of your backyard by tracking rainfall, temperature, and observed weather with hand drawn charts and graphs.
Activity
Track the Weather with Weather Charts
Activity
Track the Weather with Weather Charts
Learn about the microclimate of your backyard by tracking rainfall, temperature, and observed weather with hand drawn charts and graphs.
Third Grade
Measurement
Activity
Let's Graph Our Fall Favorites!
Lesson Plan
Let's Graph Our Fall Favorites!
Second Grade
Data and Graphing
This engaging math lesson combines all of your kid's fall favorites as they learn to represent data using a bar graph.
Lesson Plan
Let's Graph Our Fall Favorites!
Lesson Plan
Let's Graph Our Fall Favorites!
This engaging math lesson combines all of your kid's fall favorites as they learn to represent data using a bar graph.
Second Grade
Data and Graphing
Lesson Plan
Create a Color Collage
Activity
Create a Color Collage
Pre-K
Data and Graphing
Here's a preschool color collage activity to help your child work on their sorting skills, and create a beautiful addition to the refrigerator gallery.
Activity
Create a Color Collage
Activity
Create a Color Collage
Here's a preschool color collage activity to help your child work on their sorting skills, and create a beautiful addition to the refrigerator gallery.
Pre-K
Data and Graphing
Activity
Math + Love = Valentine's Day Bar Graph
Lesson Plan
Math + Love = Valentine's Day Bar Graph
Second Grade
Data and Graphing
What's more romantic than a bar graph on Valentine's Day? In this Valentine's Day lesson plan, students will use information from a data set to create their own tally charts and bar graphs and then analyze these graphs to answer questions.
Lesson Plan
Math + Love = Valentine's Day Bar Graph
Lesson Plan
Math + Love = Valentine's Day Bar Graph
What's more romantic than a bar graph on Valentine's Day? In this Valentine's Day lesson plan, students will use information from a data set to create their own tally charts and bar graphs and then analyze these graphs to answer questions.
Second Grade
Data and Graphing
Lesson Plan
Household Energy Consumption
Activity
Household Energy Consumption
Third Grade
Multiplication
Challenge your third-grader to sharpen her new math skills--and maybe do the planet a favor, too.
Activity
Household Energy Consumption
Activity
Household Energy Consumption
Challenge your third-grader to sharpen her new math skills--and maybe do the planet a favor, too.
Third Grade
Multiplication
Activity
1
2
3
4
5
6