SKIP TO CONTENT
Worksheet Generator
Subjects
Grades
Worksheets
Games
Build a Worksheet
More Resources
Roly Recommends
Summer Boost
Subjects
Grades
Worksheets
Games
Build a Worksheet
More Resources
Roly Recommends
Summer Boost
Showing Results for and data p : Page 5
Filters
Math
Data and Graphing
260 results
Search for: and, data, p
✕
Math
✕
Clear all
260 results
Subtopics:
Collecting and Organizing Data
Picture Graphs
Bar Graphs
Line Plots
Coordinate Plane
Box Plots
Histograms
Scatter Plots
Show Less
Filters
Search for: and, data, p
✕
Math
✕
Subjects
Math
English Language Arts
Science
Social Studies
Foreign Language
Grade Level
Pre-K
K
1st
2nd
3rd
4th
5th
6th
7th
8th
Early Childhood
Elementary School
Middle School
Resource Type
Worksheets
Games
Lesson Plans
Interactive Worksheets
Workbooks
Activities
Exercises
Stories
Offline Games
Guided Lessons
Teacher Resources
Occasion
Birthdays
Summer
Back to School
Halloween
Winter
Holidays
Valentine's Day
Common Core
Yes
Game Type
Ball Games
English Language Support
Yes
Clear all
View 260 results
Showing Results for and data p : Page 5
Filters
260 results
Search for: and, data, p
✕
Math
✕
Clear all
260 results
Go Runners! Practice Reading a Bar Graph
Worksheet
Go Runners! Practice Reading a Bar Graph
Third Grade
Data and Graphing
Your child will practice reading and interpreting a bar graph and using its data to answer a set of questions in this 3rd grade math worksheet.
Worksheet
Go Runners! Practice Reading a Bar Graph
Worksheet
Go Runners! Practice Reading a Bar Graph
Your child will practice reading and interpreting a bar graph and using its data to answer a set of questions in this 3rd grade math worksheet.
Third Grade
Data and Graphing
Worksheet
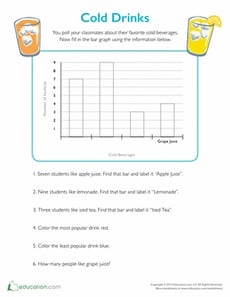
Cold Drinks Bar Graph
Worksheet
Cold Drinks Bar Graph
Second Grade
Data and Graphing
Use an easy bar graph to find out what your classmates' favorite cold drinks are. Kids will get the chance to analyze data and color in the bar graph.
Worksheet
Cold Drinks Bar Graph
Worksheet
Cold Drinks Bar Graph
Use an easy bar graph to find out what your classmates' favorite cold drinks are. Kids will get the chance to analyze data and color in the bar graph.
Second Grade
Data and Graphing
Worksheet
What is it Telling Me? Creating and Interpreting Line Plots
Lesson Plan
What is it Telling Me? Creating and Interpreting Line Plots
Third Grade
Data and Graphing
Line plots are a great way to introduce your students to graphing data. In this lesson, your students will learn how to create a line plot and also practice interpreting line plots.
Lesson Plan
What is it Telling Me? Creating and Interpreting Line Plots
Lesson Plan
What is it Telling Me? Creating and Interpreting Line Plots
Line plots are a great way to introduce your students to graphing data. In this lesson, your students will learn how to create a line plot and also practice interpreting line plots.
Third Grade
Data and Graphing
Lesson Plan
Graphing Colored Counters
Lesson Plan
Graphing Colored Counters
Kindergarten
Data and Graphing
In this lesson, your students will use the background knowledge that they have about counting and sorting to graph data. They will practice answering questions about the graph!
Lesson Plan
Graphing Colored Counters
Lesson Plan
Graphing Colored Counters
In this lesson, your students will use the background knowledge that they have about counting and sorting to graph data. They will practice answering questions about the graph!
Kindergarten
Data and Graphing
Lesson Plan
Practice Graphs
Worksheet
Practice Graphs
Second Grade
Data and Graphing
Kids practice representing a set of data using three kinds of graphs: a bar graph, pictograph, and pie graph.
Worksheet
Practice Graphs
Worksheet
Practice Graphs
Kids practice representing a set of data using three kinds of graphs: a bar graph, pictograph, and pie graph.
Second Grade
Data and Graphing
Worksheet
Scatter Plots
Worksheet
Scatter Plots
Eighth Grade
Data and Graphing
Students practice identifying outliers and the types of associations shown on scatter plots in this eighth-grade data and graphing worksheet!
Worksheet
Scatter Plots
Worksheet
Scatter Plots
Students practice identifying outliers and the types of associations shown on scatter plots in this eighth-grade data and graphing worksheet!
Eighth Grade
Data and Graphing
Worksheet
Reading Pictographs: Drink Your Milk!
Worksheet
Reading Pictographs: Drink Your Milk!
Third Grade
Data and Graphing
Can your child help Tommy figure out how much milk he drinks? As she does, she'll learn how to read and interpret data in graphs and practice multiplication.
Worksheet
Reading Pictographs: Drink Your Milk!
Worksheet
Reading Pictographs: Drink Your Milk!
Can your child help Tommy figure out how much milk he drinks? As she does, she'll learn how to read and interpret data in graphs and practice multiplication.
Third Grade
Data and Graphing
Worksheet
Mighty Mean, Median, and Mode
Lesson Plan
Mighty Mean, Median, and Mode
Fourth Grade
Data and Graphing
Give your students a good basis in interpreting data with this lesson that teaches them about mean, median, and mode with plenty of practice and cute videos to keep them interested.
Lesson Plan
Mighty Mean, Median, and Mode
Lesson Plan
Mighty Mean, Median, and Mode
Give your students a good basis in interpreting data with this lesson that teaches them about mean, median, and mode with plenty of practice and cute videos to keep them interested.
Fourth Grade
Data and Graphing
Lesson Plan
Reading Pictographs: Going to the Theater
Worksheet
Reading Pictographs: Going to the Theater
Third Grade
Data and Graphing
In this 3rd grade math worksheet, kids practice interpreting graph data as they use the information in a pictograph to answer a set of questions.
Worksheet
Reading Pictographs: Going to the Theater
Worksheet
Reading Pictographs: Going to the Theater
In this 3rd grade math worksheet, kids practice interpreting graph data as they use the information in a pictograph to answer a set of questions.
Third Grade
Data and Graphing
Worksheet
EL
Graph My Design
Lesson Plan
Graph My Design
First Grade
Geometry
Geometry meets data in this fun lesson! Students will build a design using pattern blocks and then graph the number of each shape used. This scaffolded EL lesson can be used alone or alongside
Graphing Colored Counters.
Lesson Plan
EL
Graph My Design
Lesson Plan
Graph My Design
Geometry meets data in this fun lesson! Students will build a design using pattern blocks and then graph the number of each shape used. This scaffolded EL lesson can be used alone or alongside
Graphing Colored Counters.
First Grade
Geometry
Lesson Plan
Math + Love = Valentine's Day Bar Graph
Lesson Plan
Math + Love = Valentine's Day Bar Graph
Second Grade
Data and Graphing
What's more romantic than a bar graph on Valentine's Day? In this Valentine's Day lesson plan, students will use information from a data set to create their own tally charts and bar graphs and then analyze these graphs to answer questions.
Lesson Plan
Math + Love = Valentine's Day Bar Graph
Lesson Plan
Math + Love = Valentine's Day Bar Graph
What's more romantic than a bar graph on Valentine's Day? In this Valentine's Day lesson plan, students will use information from a data set to create their own tally charts and bar graphs and then analyze these graphs to answer questions.
Second Grade
Data and Graphing
Lesson Plan
What Doesn't Belong? Quiz
Game
What Doesn't Belong? Quiz
Kindergarten
Data and Graphing
Kids must find the item that doesn't belong in this categorizing quiz.
Game
What Doesn't Belong? Quiz
Game
What Doesn't Belong? Quiz
Kids must find the item that doesn't belong in this categorizing quiz.
Kindergarten
Data and Graphing
Game
Treasure Chest Match It!
Game
Treasure Chest Match It!
Kindergarten
Data and Graphing
Arrgh! Kids must find matching items in the treasure chest before time runs out.
Game
Treasure Chest Match It!
Game
Treasure Chest Match It!
Arrgh! Kids must find matching items in the treasure chest before time runs out.
Kindergarten
Data and Graphing
Game
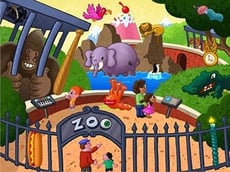
Find the Zany Zoo Objects
Game
Find the Zany Zoo Objects
Kindergarten
Data and Graphing
Your kid will examine this zoo scene and find all the objects that don't belong.
Game
Find the Zany Zoo Objects
Game
Find the Zany Zoo Objects
Your kid will examine this zoo scene and find all the objects that don't belong.
Kindergarten
Data and Graphing
Game
The Platypus
Story
The Platypus
Pre-K
Data and Graphing
Kids learn how to classify and categorize with this charming interactive story.
Story
The Platypus
Story
The Platypus
Kids learn how to classify and categorize with this charming interactive story.
Pre-K
Data and Graphing
Story
Cocoa Color Sorting
Game
Cocoa Color Sorting
Pre-K
Data and Graphing
Help your kid hone critical categorization skills in this delicious sorting game.
Game
Cocoa Color Sorting
Game
Cocoa Color Sorting
Help your kid hone critical categorization skills in this delicious sorting game.
Pre-K
Data and Graphing
Game
Picnic Color Sorting
Game
Picnic Color Sorting
Kindergarten
Data and Graphing
Kids sort items according to color and determine which number of items is greater.
Game
Picnic Color Sorting
Game
Picnic Color Sorting
Kids sort items according to color and determine which number of items is greater.
Kindergarten
Data and Graphing
Game
What Doesn't Belong?
Game
What Doesn't Belong?
Pre-K
Data and Graphing
Students click on all the things that look wildly out of place in this classroom scene.
Game
What Doesn't Belong?
Game
What Doesn't Belong?
Students click on all the things that look wildly out of place in this classroom scene.
Pre-K
Data and Graphing
Game
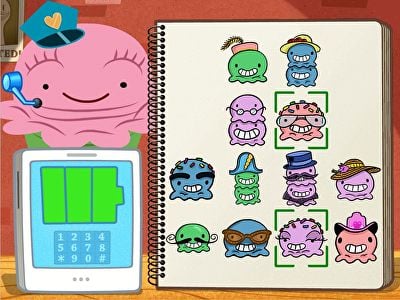
Ice Cream Detective
Game
Ice Cream Detective
Pre-K
Data and Graphing
Children will crack the case using adjectives, descriptions, and process of elimination.
Game
Ice Cream Detective
Game
Ice Cream Detective
Children will crack the case using adjectives, descriptions, and process of elimination.
Pre-K
Data and Graphing
Game
Practice Reading Venn Diagrams #1: Favorite Hobby
Worksheet
Practice Reading Venn Diagrams #1: Favorite Hobby
Second Grade
Data and Graphing
Kids practice reading a Venn diagram about favorite hobbies and answer questions about it in this 2nd grade math worksheet.
Worksheet
Practice Reading Venn Diagrams #1: Favorite Hobby
Worksheet
Practice Reading Venn Diagrams #1: Favorite Hobby
Kids practice reading a Venn diagram about favorite hobbies and answer questions about it in this 2nd grade math worksheet.
Second Grade
Data and Graphing
Worksheet
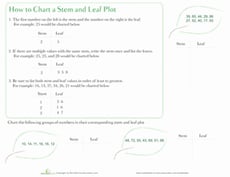
Stem and Leaf Plot
Worksheet
Stem and Leaf Plot
Third Grade
Data and Graphing
Nature is all around you -- even in your math textbooks! Get to the bottom of stem and leaf plots with this helpful worksheet.
Worksheet
Stem and Leaf Plot
Worksheet
Stem and Leaf Plot
Nature is all around you -- even in your math textbooks! Get to the bottom of stem and leaf plots with this helpful worksheet.
Third Grade
Data and Graphing
Worksheet
Box Plots #3
Interactive Worksheet
Box Plots #3
Sixth Grade
Data and Graphing
Become an expert at interpreting box plots with this sixth-grade worksheet!
Interactive Worksheet
Box Plots #3
Interactive Worksheet
Box Plots #3
Become an expert at interpreting box plots with this sixth-grade worksheet!
Sixth Grade
Data and Graphing
Interactive Worksheet
Practice Reading Venn Diagrams #3: Favorite Dessert
Worksheet
Practice Reading Venn Diagrams #3: Favorite Dessert
Second Grade
Data and Graphing
Kids practice reading a Venn diagram about favorite desserts and answer questions about it in this 2nd grade math worksheet.
Worksheet
Practice Reading Venn Diagrams #3: Favorite Dessert
Worksheet
Practice Reading Venn Diagrams #3: Favorite Dessert
Kids practice reading a Venn diagram about favorite desserts and answer questions about it in this 2nd grade math worksheet.
Second Grade
Data and Graphing
Worksheet
Making Comparative Inferences
Worksheet
Making Comparative Inferences
Seventh Grade
Data and Graphing
Give students practice creating box plots and making comparative inferences with this seventh-grade math worksheet!
Worksheet
Making Comparative Inferences
Worksheet
Making Comparative Inferences
Give students practice creating box plots and making comparative inferences with this seventh-grade math worksheet!
Seventh Grade
Data and Graphing
Worksheet
Practice Reading Venn Diagrams #2: In the Orchestra
Worksheet
Practice Reading Venn Diagrams #2: In the Orchestra
Second Grade
Data and Graphing
Kids practice reading a Venn diagram about instruments in an orchestra and answering questions about it in this 2nd grade math worksheet.
Worksheet
Practice Reading Venn Diagrams #2: In the Orchestra
Worksheet
Practice Reading Venn Diagrams #2: In the Orchestra
Kids practice reading a Venn diagram about instruments in an orchestra and answering questions about it in this 2nd grade math worksheet.
Second Grade
Data and Graphing
Worksheet
Picture Graphing with Fish
Game
Picture Graphing with Fish
Third Grade
Data and Graphing
Fish, fish everywhere! Kids catch fish to sort and graph in this zany game.
Game
Picture Graphing with Fish
Game
Picture Graphing with Fish
Fish, fish everywhere! Kids catch fish to sort and graph in this zany game.
Third Grade
Data and Graphing
Game
Constructing Two-Way Relative Frequency Tables
Interactive Worksheet
Constructing Two-Way Relative Frequency Tables
Eighth Grade
Data and Graphing
Practice creating two-way relative frequency tables based on real-world scenarios with this eighth-grade math worksheet!
Interactive Worksheet
Constructing Two-Way Relative Frequency Tables
Interactive Worksheet
Constructing Two-Way Relative Frequency Tables
Practice creating two-way relative frequency tables based on real-world scenarios with this eighth-grade math worksheet!
Eighth Grade
Data and Graphing
Interactive Worksheet
Graph My Design
Worksheet
Graph My Design
First Grade
Data and Graphing
Students build a design and then use this bar graph to show how many of each shape was used. Place inside a sheet protector to reuse.
Worksheet
Graph My Design
Worksheet
Graph My Design
Students build a design and then use this bar graph to show how many of each shape was used. Place inside a sheet protector to reuse.
First Grade
Data and Graphing
Worksheet
Ice Cream Graph #19
Worksheet
Ice Cream Graph #19
First Grade
Data and Graphing
Ice cream for sale! Sam, Kate, and Becky need help keeping track of how many ice cream cones they've sold. Your child will complete a pictograph to help them.
Worksheet
Ice Cream Graph #19
Worksheet
Ice Cream Graph #19
Ice cream for sale! Sam, Kate, and Becky need help keeping track of how many ice cream cones they've sold. Your child will complete a pictograph to help them.
First Grade
Data and Graphing
Worksheet
Describing Distributions in Dot Plots
Worksheet
Describing Distributions in Dot Plots
Sixth Grade
Data and Graphing
Students explore distributions in dot plots with this sixth-grade statistics worksheet!
Worksheet
Describing Distributions in Dot Plots
Worksheet
Describing Distributions in Dot Plots
Students explore distributions in dot plots with this sixth-grade statistics worksheet!
Sixth Grade
Data and Graphing
Worksheet
1
…
4
5
6
…
9