SKIP TO CONTENT
Worksheet Generator
Subjects
Grades
Worksheets
Games
Build a Worksheet
More Resources
Roly Recommends
Subjects
Grades
Worksheets
Games
Build a Worksheet
More Resources
Roly Recommends
All Subjects
Math
Data and Graphing
Subtopics:
Collecting and Organizing Data
Picture Graphs
Bar Graphs
Line Plots
Coordinate Plane
Box Plots
Histograms
Scatter Plots
Show Less
Filters
Search for: three, digit, and, regrouping, with, two, zeros
✕
Math
✕
Subjects
Math
English Language Arts
Science
Social Studies
Foreign Language
Grade Level
Pre-K
K
1st
2nd
3rd
4th
5th
6th
7th
8th
Early Childhood
Elementary School
Middle School
Resource Type
Worksheets
Games
Lesson Plans
Interactive Worksheets
Workbooks
Activities
Exercises
Offline Games
Guided Lessons
Teacher Resources
Occasion
Birthdays
St. Patrick's Day
Summer
Independence Day
Halloween
Winter
Holidays
Lunar New Year
Valentine's Day
Common Core
Yes
Game Type
Ball Games
Printable Board Games
Arts & Crafts
Arts & Crafts
Paper & Glue Crafts
Construction & Sculpture
Painting & Drawing
English Language Support
Yes
See More
Clear All
View 179 results
Showing Results for three digit and regrouping with two zeros : Page 3
179 results
Search for: three, digit, and, regrouping, with, two, zeros
✕
Math
✕
Sort by:
Relevance
Most recent
Most popular
Alphabetical A-Z
Alphabetical Z-A
All filters
179 results
Sort by:
Relevance
Most recent
Most popular
Alphabetical A-Z
Alphabetical Z-A
Comparing Pictographs: Taxi, Taxi
Worksheet
Comparing Pictographs: Taxi, Taxi
Third Grade
Addition
In this 3rd grade math worksheet, kids analyze and compare data in two pictographs in order to answer a set of word problems.
Worksheet
Comparing Pictographs: Taxi, Taxi
Worksheet
Comparing Pictographs: Taxi, Taxi
In this 3rd grade math worksheet, kids analyze and compare data in two pictographs in order to answer a set of word problems.
Third Grade
Addition
Worksheet
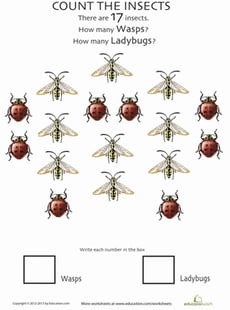
Insect Counting Worksheet: Wasps and Ladybugs
Worksheet
Insect Counting Worksheet: Wasps and Ladybugs
Kindergarten
Numbers and Counting
You wouldn't want to mistake a wasp for a ladybug! Challenge your kindergartener to keep the two bugs separate in this counting worksheet.
Worksheet
Insect Counting Worksheet: Wasps and Ladybugs
Worksheet
Insect Counting Worksheet: Wasps and Ladybugs
You wouldn't want to mistake a wasp for a ladybug! Challenge your kindergartener to keep the two bugs separate in this counting worksheet.
Kindergarten
Numbers and Counting
Worksheet
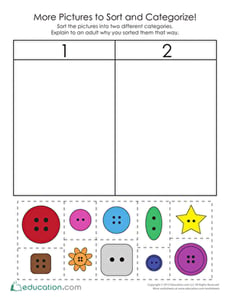
More Pictures to Sort and Categorize
Worksheet
More Pictures to Sort and Categorize
Pre-K
Data and Graphing
In this worksheet, your child will practice identifying shapes and sizes of buttons. Cut them out, and sort them into two distinct categories.
Worksheet
More Pictures to Sort and Categorize
Worksheet
More Pictures to Sort and Categorize
In this worksheet, your child will practice identifying shapes and sizes of buttons. Cut them out, and sort them into two distinct categories.
Pre-K
Data and Graphing
Worksheet
Comparing Pictographs: Football Time
Worksheet
Comparing Pictographs: Football Time
Third Grade
Data and Graphing
In this math worksheet, kids compare two pictographs that record the number of footballs kicked and the number of footballs thrown on the field.
Worksheet
Comparing Pictographs: Football Time
Worksheet
Comparing Pictographs: Football Time
In this math worksheet, kids compare two pictographs that record the number of footballs kicked and the number of footballs thrown on the field.
Third Grade
Data and Graphing
Worksheet
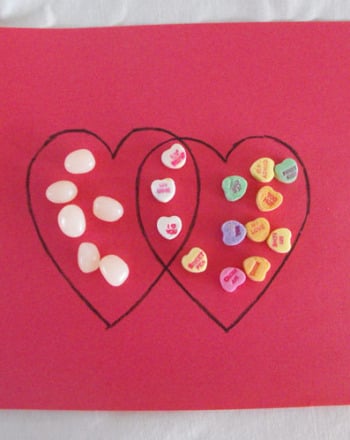
Valentine's Venn Diagram
Activity
Valentine's Venn Diagram
Kindergarten
Data and Graphing
In this simple math activity, your young learner will compare two types of Valentine's Day candy using a Venn diagram.
Activity
Valentine's Venn Diagram
Activity
Valentine's Venn Diagram
In this simple math activity, your young learner will compare two types of Valentine's Day candy using a Venn diagram.
Kindergarten
Data and Graphing
Activity
Lemonade Stand Pictograph
Worksheet
Lemonade Stand Pictograph
Second Grade
Data and Graphing
See how Susie's lemonade stand is doing! Students will learn how to analyze and compare data by answering questions based on the two pictographs.
Worksheet
Lemonade Stand Pictograph
Worksheet
Lemonade Stand Pictograph
See how Susie's lemonade stand is doing! Students will learn how to analyze and compare data by answering questions based on the two pictographs.
Second Grade
Data and Graphing
Worksheet
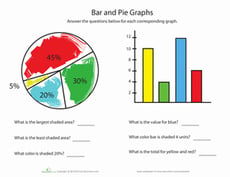
Different Types of Graphs: Picture and Bar Graphs
Worksheet
Different Types of Graphs: Picture and Bar Graphs
First Grade
Data and Graphing
Sure to test your kid's graphing skills, this graph worksheet features two different types of graphs and questions to go along with them.
Worksheet
Different Types of Graphs: Picture and Bar Graphs
Worksheet
Different Types of Graphs: Picture and Bar Graphs
Sure to test your kid's graphing skills, this graph worksheet features two different types of graphs and questions to go along with them.
First Grade
Data and Graphing
Worksheet
Sink the Ship: Coordinate Plane Activity
Worksheet
Sink the Ship: Coordinate Plane Activity
Sixth Grade
Data and Graphing
In this printable two-player game, learners practice graphing points in four quadrants of the coordinate plane and calling out ordered pairs.
Worksheet
Sink the Ship: Coordinate Plane Activity
Worksheet
Sink the Ship: Coordinate Plane Activity
In this printable two-player game, learners practice graphing points in four quadrants of the coordinate plane and calling out ordered pairs.
Sixth Grade
Data and Graphing
Worksheet
Comparing Pictographs: Tulips and Daisies
Worksheet
Comparing Pictographs: Tulips and Daisies
Second Grade
Data and Graphing
Your child will use the data in two pictographs that show the number of tulips and daisies imported from certain European countries to answer word problems.
Worksheet
Comparing Pictographs: Tulips and Daisies
Worksheet
Comparing Pictographs: Tulips and Daisies
Your child will use the data in two pictographs that show the number of tulips and daisies imported from certain European countries to answer word problems.
Second Grade
Data and Graphing
Worksheet
Dot Plots
Worksheet
Dot Plots
Sixth Grade
Data and Graphing
Covering a variety of interesting real-life contexts, this two-page math worksheet gives learners practice turning data sets into dot plots that are representative of each scenario.
Worksheet
Dot Plots
Worksheet
Dot Plots
Covering a variety of interesting real-life contexts, this two-page math worksheet gives learners practice turning data sets into dot plots that are representative of each scenario.
Sixth Grade
Data and Graphing
Worksheet
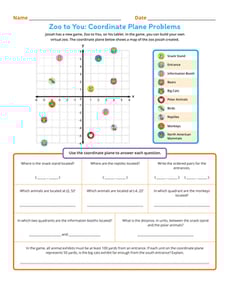
Zoo to You: Coordinate Plane Problems
Worksheet
Zoo to You: Coordinate Plane Problems
Sixth Grade
Geometry
Learners solve real-world problems on the coordinate plane as they write ordered pairs, identify the quadrants, and find the distance between two points!
Worksheet
Zoo to You: Coordinate Plane Problems
Worksheet
Zoo to You: Coordinate Plane Problems
Learners solve real-world problems on the coordinate plane as they write ordered pairs, identify the quadrants, and find the distance between two points!
Sixth Grade
Geometry
Worksheet
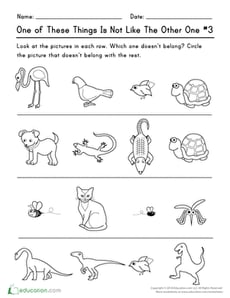
One of These Things Is Not Like The Other One (Part Three)
Worksheet
One of These Things Is Not Like The Other One (Part Three)
Kindergarten
Data and Graphing
With this worksheet, your students will have fun circling the objects that do not belong with the others.
Worksheet
One of These Things Is Not Like The Other One (Part Three)
Worksheet
One of These Things Is Not Like The Other One (Part Three)
With this worksheet, your students will have fun circling the objects that do not belong with the others.
Kindergarten
Data and Graphing
Worksheet
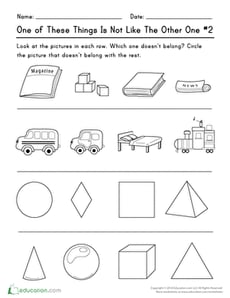
One of These Things Is Not Like The Other One (Part Two)
Worksheet
One of These Things Is Not Like The Other One (Part Two)
Kindergarten
Data and Graphing
Your students will have fun looking at the pictures in each row and deciding which item is not like the others.
Worksheet
One of These Things Is Not Like The Other One (Part Two)
Worksheet
One of These Things Is Not Like The Other One (Part Two)
Your students will have fun looking at the pictures in each row and deciding which item is not like the others.
Kindergarten
Data and Graphing
Worksheet
Geometry 7
Guided Lesson
Geometry 7
Fifth Grade
Geometry
This geometry unit engages students in analytical thinking as they learn about the properties of two dimensional figures and consider the different ways they can be sorted based on those properties. Students also learn to plot points, lines and shapes on a coordinate graph.
Guided Lesson
Geometry 7
Guided Lesson
Geometry 7
This geometry unit engages students in analytical thinking as they learn about the properties of two dimensional figures and consider the different ways they can be sorted based on those properties. Students also learn to plot points, lines and shapes on a coordinate graph.
Fifth Grade
Geometry
Guided Lesson
Addition 1
Guided Lesson
Addition 1
Kindergarten
Addition
Learning to add single-digit numbers is a highlight of the kindergarten math curriculum. You can support addition fluency with this guided lesson that takes kindergarteners through an understanding of values. Kids will learn with focused instruction and practice that by putting numbers together, they get a new number. When the lesson is over, kids can continue practicing addition with our accompanying worksheets.
Guided Lesson
Addition 1
Guided Lesson
Addition 1
Learning to add single-digit numbers is a highlight of the kindergarten math curriculum. You can support addition fluency with this guided lesson that takes kindergarteners through an understanding of values. Kids will learn with focused instruction and practice that by putting numbers together, they get a new number. When the lesson is over, kids can continue practicing addition with our accompanying worksheets.
Kindergarten
Addition
Guided Lesson
Measurement and Data 4
Guided Lesson
Measurement and Data 4
Fourth Grade
Fractions
Representing data on graphs makes math visual and involves some creativity and design. Plotting data using fractional units takes their learning one step further. Also in this unit, students learn to measure using both traditional units (like inches, feet and yards) and metric units, and how to convert measurements within each system. The concept of measurement gets two dimensional when students explore measuring and working with angles.
Guided Lesson
Measurement and Data 4
Guided Lesson
Measurement and Data 4
Representing data on graphs makes math visual and involves some creativity and design. Plotting data using fractional units takes their learning one step further. Also in this unit, students learn to measure using both traditional units (like inches, feet and yards) and metric units, and how to convert measurements within each system. The concept of measurement gets two dimensional when students explore measuring and working with angles.
Fourth Grade
Fractions
Guided Lesson
Basic Pictographs
Worksheet
Basic Pictographs
First Grade
Data and Graphing
Practice adding multiple digits with a fun pictograph page. Use the chart to draw out the number of items in each problem.
Worksheet
Basic Pictographs
Worksheet
Basic Pictographs
Practice adding multiple digits with a fun pictograph page. Use the chart to draw out the number of items in each problem.
First Grade
Data and Graphing
Worksheet
Addition Picture Graphs
Worksheet
Addition Picture Graphs
First Grade
Data and Graphing
Explore some stellar math concepts with this worksheet on adding multiple digits. Fill in the pictograph to help you visualize the problem first.
Worksheet
Addition Picture Graphs
Worksheet
Addition Picture Graphs
Explore some stellar math concepts with this worksheet on adding multiple digits. Fill in the pictograph to help you visualize the problem first.
First Grade
Data and Graphing
Worksheet
Dice Probability
Activity
Dice Probability
Fourth Grade
Data and Graphing
Analyze this simple betting game with your fourth grade student in order to discuss probability.
Activity
Dice Probability
Activity
Dice Probability
Analyze this simple betting game with your fourth grade student in order to discuss probability.
Fourth Grade
Data and Graphing
Activity
Less Than or Greater Than: 1 to 20
Game
Less Than or Greater Than: 1 to 20
First Grade
Numbers and Counting
The alligators are hungry for numbers, and kids use number skills to feed them.
Game
Less Than or Greater Than: 1 to 20
Game
Less Than or Greater Than: 1 to 20
The alligators are hungry for numbers, and kids use number skills to feed them.
First Grade
Numbers and Counting
Game
Probability Dice Game
Activity
Probability Dice Game
Fifth Grade
Data and Graphing
Check out this dice game perfect for teaching your savvy kid the fundamentals of probability.
Activity
Probability Dice Game
Activity
Probability Dice Game
Check out this dice game perfect for teaching your savvy kid the fundamentals of probability.
Fifth Grade
Data and Graphing
Activity
2D and 3D Shape Sort: Factory
Game
2D and 3D Shape Sort: Factory
Kindergarten
Geometry
Kids sort 2D and 3D shapes in this engaging geometry game.
Game
2D and 3D Shape Sort: Factory
Game
2D and 3D Shape Sort: Factory
Kids sort 2D and 3D shapes in this engaging geometry game.
Kindergarten
Geometry
Game
From Dot Plots to Histograms
Worksheet
From Dot Plots to Histograms
Sixth Grade
Data and Graphing
Discover different ways to display data in this delightful sixth-grade worksheet!
Worksheet
From Dot Plots to Histograms
Worksheet
From Dot Plots to Histograms
Discover different ways to display data in this delightful sixth-grade worksheet!
Sixth Grade
Data and Graphing
Worksheet
Solve a Graph Puzzle
Activity
Solve a Graph Puzzle
Fifth Grade
Data and Graphing
Here's a fun, geometric puzzle activity that will capture your child's interest and strengthen his number awareness and graphing skills.
Activity
Solve a Graph Puzzle
Activity
Solve a Graph Puzzle
Here's a fun, geometric puzzle activity that will capture your child's interest and strengthen his number awareness and graphing skills.
Fifth Grade
Data and Graphing
Activity
Graph Proportional Relationships #1
Worksheet
Graph Proportional Relationships #1
Eighth Grade
Ratios and Proportions
Help learners connect the constant of proportionality with the slope of a line in this one-page graphing worksheet!
Worksheet
Graph Proportional Relationships #1
Worksheet
Graph Proportional Relationships #1
Help learners connect the constant of proportionality with the slope of a line in this one-page graphing worksheet!
Eighth Grade
Ratios and Proportions
Worksheet
Practice Reading Venn Diagrams #1: Favorite Hobby
Worksheet
Practice Reading Venn Diagrams #1: Favorite Hobby
Second Grade
Data and Graphing
Kids practice reading a Venn diagram about favorite hobbies and answer questions about it in this 2nd grade math worksheet.
Worksheet
Practice Reading Venn Diagrams #1: Favorite Hobby
Worksheet
Practice Reading Venn Diagrams #1: Favorite Hobby
Kids practice reading a Venn diagram about favorite hobbies and answer questions about it in this 2nd grade math worksheet.
Second Grade
Data and Graphing
Worksheet
Creating Histograms From Frequency Tables
Worksheet
Creating Histograms From Frequency Tables
Sixth Grade
Data and Graphing
Practice using histograms to show different sets of data in this engaging sixth-grade worksheet!
Worksheet
Creating Histograms From Frequency Tables
Worksheet
Creating Histograms From Frequency Tables
Practice using histograms to show different sets of data in this engaging sixth-grade worksheet!
Sixth Grade
Data and Graphing
Worksheet
Make a Venn Diagram: Gift Boxes
Worksheet
Make a Venn Diagram: Gift Boxes
Second Grade
Data and Graphing
Kids practice making a Venn diagram about kinds of gift wrap by sorting the gifts in their correct spaces in this 2nd grade math worksheet.
Worksheet
Make a Venn Diagram: Gift Boxes
Worksheet
Make a Venn Diagram: Gift Boxes
Kids practice making a Venn diagram about kinds of gift wrap by sorting the gifts in their correct spaces in this 2nd grade math worksheet.
Second Grade
Data and Graphing
Worksheet
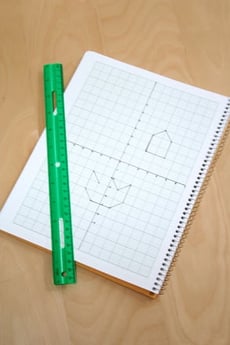
Graph My Design
Lesson Plan
Graph My Design
First Grade
Geometry
Geometry meets data in this fun lesson! Students will build a design using pattern blocks and then graph the number of each shape used. This scaffolded EL lesson can be used alone or alongside
Graphing Colored Counters.
Lesson Plan
Graph My Design
Lesson Plan
Graph My Design
Geometry meets data in this fun lesson! Students will build a design using pattern blocks and then graph the number of each shape used. This scaffolded EL lesson can be used alone or alongside
Graphing Colored Counters.
First Grade
Geometry
Lesson Plan
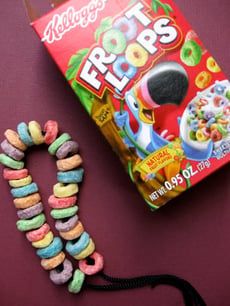
Make an Edible Fruitloop Bracelet
Activity
Make an Edible Fruitloop Bracelet
Kindergarten
Data and Graphing
Make an edible bracelet from Froot Loops and a shoelace! This Block Institute art activity will engage your special needs or mainstream child at snacktime.
Activity
Make an Edible Fruitloop Bracelet
Activity
Make an Edible Fruitloop Bracelet
Make an edible bracelet from Froot Loops and a shoelace! This Block Institute art activity will engage your special needs or mainstream child at snacktime.
Kindergarten
Data and Graphing
Activity
1
2
3
4
5
6