SKIP TO CONTENT
Worksheet Generator
Subjects
Grades
Worksheets
Games
Build a Worksheet
More Resources
Roly Recommends
Subjects
Grades
Worksheets
Games
Build a Worksheet
More Resources
Roly Recommends
All Subjects
Math
Data and Graphing
Subtopics:
Collecting and Organizing Data
Picture Graphs
Bar Graphs
Line Plots
Coordinate Plane
Box Plots
Histograms
Scatter Plots
Show Less
Filters
Search for: results, in, interpreting, data
✕
Math
✕
Subjects
Math
English Language Arts
Science
Social Studies
Foreign Language
Grade Level
Pre-K
K
1st
2nd
3rd
4th
5th
6th
7th
8th
Early Childhood
Elementary School
Middle School
Resource Type
Worksheets
Games
Lesson Plans
Interactive Worksheets
Workbooks
Activities
Exercises
Offline Games
Guided Lessons
Teacher Resources
Occasion
Birthdays
Summer
Back to School
Halloween
Winter
Holidays
Valentine's Day
Common Core
Yes
Game Type
Ball Games
Arts & Crafts
Arts & Crafts
Construction & Sculpture
English Language Support
Yes
See More
Clear All
View 268 results
Showing Results for results in interpreting data : Page 2
268 results
Search for: results, in, interpreting, data
✕
Math
✕
Sort by:
Relevance
Most recent
Most popular
Alphabetical A-Z
Alphabetical Z-A
All filters
268 results
Sort by:
Relevance
Most recent
Most popular
Alphabetical A-Z
Alphabetical Z-A
Interpreting Double Bar Graphs
Worksheet
Interpreting Double Bar Graphs
Fifth Grade
Data and Graphing
Students will cultivate the skills of reading, interpreting, and analyzing bar graphs with these questions that activate higher order thinking.
Worksheet
Interpreting Double Bar Graphs
Worksheet
Interpreting Double Bar Graphs
Students will cultivate the skills of reading, interpreting, and analyzing bar graphs with these questions that activate higher order thinking.
Fifth Grade
Data and Graphing
Worksheet
Create a Picture Graph (with your own data)
Worksheet
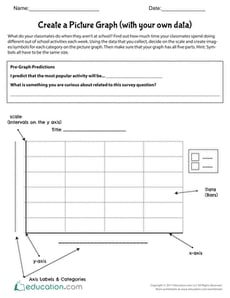
Create a Picture Graph (with your own data)
Fifth Grade
Data and Graphing
Using data that your students will generate in their class, they will create a picture graph that reflects how much time they spend doing different activities each week.
Worksheet
Create a Picture Graph (with your own data)
Worksheet
Create a Picture Graph (with your own data)
Using data that your students will generate in their class, they will create a picture graph that reflects how much time they spend doing different activities each week.
Fifth Grade
Data and Graphing
Worksheet
Create a Double Bar Graph (with your own data)
Worksheet
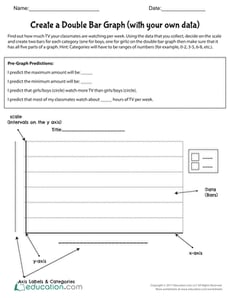
Create a Double Bar Graph (with your own data)
Fifth Grade
Data and Graphing
Students will collect data, create a double bar graph, and interpret the graph by responding to prompts that will get them thinking critically.
Worksheet
Create a Double Bar Graph (with your own data)
Worksheet
Create a Double Bar Graph (with your own data)
Students will collect data, create a double bar graph, and interpret the graph by responding to prompts that will get them thinking critically.
Fifth Grade
Data and Graphing
Worksheet
Doing Data: The Pet Store Tally
Worksheet
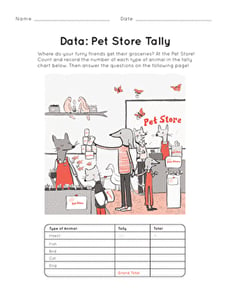
Doing Data: The Pet Store Tally
First Grade
Data and Graphing
Not only is this filled with cute animal images, but it gives your first grader just the practice they need to get comfortable tallying up sets of data.
Worksheet
Doing Data: The Pet Store Tally
Worksheet
Doing Data: The Pet Store Tally
Not only is this filled with cute animal images, but it gives your first grader just the practice they need to get comfortable tallying up sets of data.
First Grade
Data and Graphing
Worksheet
Word Problems: Interpreting Picture Graphs
Worksheet
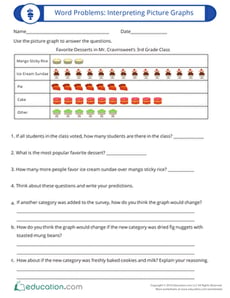
Word Problems: Interpreting Picture Graphs
Third Grade
Data and Graphing
Students will cultivate the skills of reading, interpreting and analyzing picture graphs with this word problem that activates higher order thinking.
Worksheet
Word Problems: Interpreting Picture Graphs
Worksheet
Word Problems: Interpreting Picture Graphs
Students will cultivate the skills of reading, interpreting and analyzing picture graphs with this word problem that activates higher order thinking.
Third Grade
Data and Graphing
Worksheet
Create a Line Plot with Data Provided
Worksheet
Create a Line Plot with Data Provided
Third Grade
Data and Graphing
Use the data provided to have your students create a line plot that reflects how much TV watched per week for one third grade class.
Worksheet
Create a Line Plot with Data Provided
Worksheet
Create a Line Plot with Data Provided
Use the data provided to have your students create a line plot that reflects how much TV watched per week for one third grade class.
Third Grade
Data and Graphing
Worksheet
Record Your Fall Favorites
Worksheet
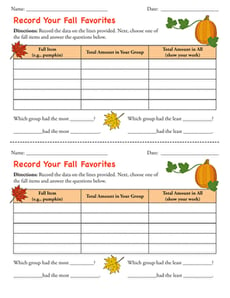
Record Your Fall Favorites
Second Grade
Data and Graphing
Use this template alongside the engaging lesson, “Let’s Graph Our Fall Favorites” to support kids in interpreting data.
Worksheet
Record Your Fall Favorites
Worksheet
Record Your Fall Favorites
Use this template alongside the engaging lesson, “Let’s Graph Our Fall Favorites” to support kids in interpreting data.
Second Grade
Data and Graphing
Worksheet
Pet Survey
Worksheet
Pet Survey
First Grade
Data and Graphing
Have your students survey one another about pet preferences using this interactive activity designed to practice representing and interpreting data.
Worksheet
Pet Survey
Worksheet
Pet Survey
Have your students survey one another about pet preferences using this interactive activity designed to practice representing and interpreting data.
First Grade
Data and Graphing
Worksheet
Line Plot Practice
Worksheet
Line Plot Practice
Second Grade
Data and Graphing
Use this worksheet to get your mathematicians comfortable and confident creating and interpreting line plots from a given set of data.
Worksheet
Line Plot Practice
Worksheet
Line Plot Practice
Use this worksheet to get your mathematicians comfortable and confident creating and interpreting line plots from a given set of data.
Second Grade
Data and Graphing
Worksheet
Reading Pictographs: Building a New Town
Worksheet
Reading Pictographs: Building a New Town
Third Grade
Data and Graphing
In this 3rd grade math worksheet, kids practice interpreting graph data and using information in a pictograph to answer word problems.
Worksheet
Reading Pictographs: Building a New Town
Worksheet
Reading Pictographs: Building a New Town
In this 3rd grade math worksheet, kids practice interpreting graph data and using information in a pictograph to answer word problems.
Third Grade
Data and Graphing
Worksheet
Go Runners! Practice Reading a Bar Graph
Worksheet
Go Runners! Practice Reading a Bar Graph
Third Grade
Data and Graphing
Your child will practice reading and interpreting a bar graph and using its data to answer a set of questions in this 3rd grade math worksheet.
Worksheet
Go Runners! Practice Reading a Bar Graph
Worksheet
Go Runners! Practice Reading a Bar Graph
Your child will practice reading and interpreting a bar graph and using its data to answer a set of questions in this 3rd grade math worksheet.
Third Grade
Data and Graphing
Worksheet
Graphing Survey Data
Worksheet
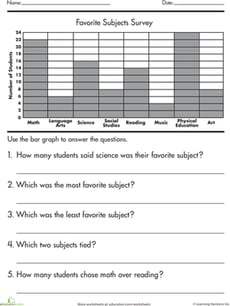
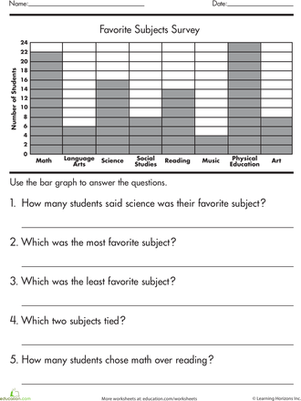
Graphing Survey Data
Second Grade
Data and Graphing
If your second grader is stumped by bar graphs, clear up the confusion with this worksheet that helps kids learn how to read and interpret a bar graph.
Worksheet
Graphing Survey Data
Worksheet
Graphing Survey Data
If your second grader is stumped by bar graphs, clear up the confusion with this worksheet that helps kids learn how to read and interpret a bar graph.
Second Grade
Data and Graphing
Worksheet
Reading Pictographs: Going to the Theater
Worksheet
Reading Pictographs: Going to the Theater
Third Grade
Data and Graphing
In this 3rd grade math worksheet, kids practice interpreting graph data as they use the information in a pictograph to answer a set of questions.
Worksheet
Reading Pictographs: Going to the Theater
Worksheet
Reading Pictographs: Going to the Theater
In this 3rd grade math worksheet, kids practice interpreting graph data as they use the information in a pictograph to answer a set of questions.
Third Grade
Data and Graphing
Worksheet
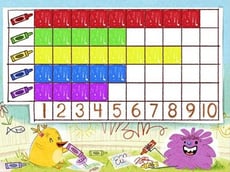
Graphing Data: Colors
Worksheet
Graphing Data: Colors
Second Grade
Data and Graphing
Help the concept of graphing really sink in by challenging your second grader to graph kids' favorite colors using a table, tally mark table, and grid.
Worksheet
Graphing Data: Colors
Worksheet
Graphing Data: Colors
Help the concept of graphing really sink in by challenging your second grader to graph kids' favorite colors using a table, tally mark table, and grid.
Second Grade
Data and Graphing
Worksheet
Drawing Inferences Using Data
Worksheet
Drawing Inferences Using Data
Seventh Grade
Data and Graphing
Students compare different survey methods to make inferences about how much time students at a school spend playing video games in this seventh-grade math worksheet.
Worksheet
Drawing Inferences Using Data
Worksheet
Drawing Inferences Using Data
Students compare different survey methods to make inferences about how much time students at a school spend playing video games in this seventh-grade math worksheet.
Seventh Grade
Data and Graphing
Worksheet
Creating a Bar Graph: Favorite Picnic Spots
Worksheet
Creating a Bar Graph: Favorite Picnic Spots
Second Grade
Data and Graphing
Learners practice charting and graphing data in this hands-on worksheet.
Worksheet
Creating a Bar Graph: Favorite Picnic Spots
Worksheet
Creating a Bar Graph: Favorite Picnic Spots
Learners practice charting and graphing data in this hands-on worksheet.
Second Grade
Data and Graphing
Worksheet
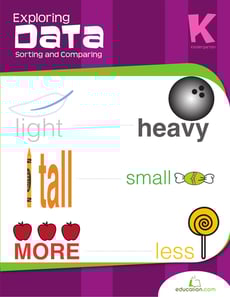
Exploring Data: Sorting and Comparing
Workbook
Exploring Data: Sorting and Comparing
Kindergarten
Numbers and Counting
There is a mix of objects in this workbook and it's up to your child to sort them by colors, shapes and sizes. Plus, he'll practice identifying weight and making simple comparisons.
Workbook
Exploring Data: Sorting and Comparing
Workbook
Exploring Data: Sorting and Comparing
There is a mix of objects in this workbook and it's up to your child to sort them by colors, shapes and sizes. Plus, he'll practice identifying weight and making simple comparisons.
Kindergarten
Numbers and Counting
Workbook
Mighty Mean, Median, and Mode
Lesson Plan
Mighty Mean, Median, and Mode
Fourth Grade
Data and Graphing
Give your students a good basis in interpreting data with this lesson that teaches them about mean, median, and mode with plenty of practice and cute videos to keep them interested.
Lesson Plan
Mighty Mean, Median, and Mode
Lesson Plan
Mighty Mean, Median, and Mode
Give your students a good basis in interpreting data with this lesson that teaches them about mean, median, and mode with plenty of practice and cute videos to keep them interested.
Fourth Grade
Data and Graphing
Lesson Plan
Create a Line Plot (With Your Own Data!)
Worksheet
Create a Line Plot (With Your Own Data!)
Second Grade
Data and Graphing
Invite students to become researchers with this open-ended line plot template!
Worksheet
Create a Line Plot (With Your Own Data!)
Worksheet
Create a Line Plot (With Your Own Data!)
Invite students to become researchers with this open-ended line plot template!
Second Grade
Data and Graphing
Worksheet
From Dot Plots to Histograms
Worksheet
From Dot Plots to Histograms
Sixth Grade
Data and Graphing
Discover different ways to display data in this delightful sixth-grade worksheet!
Worksheet
From Dot Plots to Histograms
Worksheet
From Dot Plots to Histograms
Discover different ways to display data in this delightful sixth-grade worksheet!
Sixth Grade
Data and Graphing
Worksheet
Box Plots #1
Interactive Worksheet
Box Plots #1
Sixth Grade
Data and Graphing
Practice interpreting box plots with this sixth-grade worksheet!
Interactive Worksheet
Box Plots #1
Interactive Worksheet
Box Plots #1
Practice interpreting box plots with this sixth-grade worksheet!
Sixth Grade
Data and Graphing
Interactive Worksheet
Practice Finding Range
Worksheet
Practice Finding Range
Sixth Grade
Data and Graphing
Give your students practice finding the range of a data set with this sixth-grade data and graphing worksheet!
Worksheet
Practice Finding Range
Worksheet
Practice Finding Range
Give your students practice finding the range of a data set with this sixth-grade data and graphing worksheet!
Sixth Grade
Data and Graphing
Worksheet
Interpreting Two-Way Frequency Tables
Worksheet
Interpreting Two-Way Frequency Tables
Eighth Grade
Data and Graphing
Students analyze two-way frequency tables in the context of relatable scenarios in this eighth-grade math worksheet!
Worksheet
Interpreting Two-Way Frequency Tables
Worksheet
Interpreting Two-Way Frequency Tables
Students analyze two-way frequency tables in the context of relatable scenarios in this eighth-grade math worksheet!
Eighth Grade
Data and Graphing
Worksheet
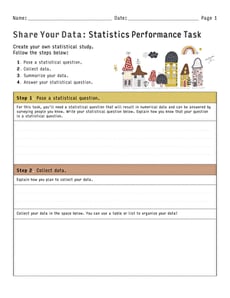
Share Your Data: Statistics Performance Task
Worksheet
Share Your Data: Statistics Performance Task
Sixth Grade
Data and Graphing
Create your own statistical study with this open-ended math worksheet for sixth graders!
Worksheet
Share Your Data: Statistics Performance Task
Worksheet
Share Your Data: Statistics Performance Task
Create your own statistical study with this open-ended math worksheet for sixth graders!
Sixth Grade
Data and Graphing
Worksheet
Word Problems: Interpreting Line Plots
Worksheet
Word Problems: Interpreting Line Plots
Second Grade
Data and Graphing
Students will have a chance to practice solving word problems using line plots with this worksheet.
Worksheet
Word Problems: Interpreting Line Plots
Worksheet
Word Problems: Interpreting Line Plots
Students will have a chance to practice solving word problems using line plots with this worksheet.
Second Grade
Data and Graphing
Worksheet
Histograms
Worksheet
Histograms
Sixth Grade
Data and Graphing
In this sixth-grade data and graphing worksheet, students will complete histograms from given data sets and frequency tables.
Worksheet
Histograms
Worksheet
Histograms
In this sixth-grade data and graphing worksheet, students will complete histograms from given data sets and frequency tables.
Sixth Grade
Data and Graphing
Worksheet
Do We Wear the Same Colors?
Activity
Do We Wear the Same Colors?
Third Grade
Data and Graphing
Hone observational skills and introduce the basics of data interpretation with this data gathering activity all about the different colors people wear.
Activity
Do We Wear the Same Colors?
Activity
Do We Wear the Same Colors?
Hone observational skills and introduce the basics of data interpretation with this data gathering activity all about the different colors people wear.
Third Grade
Data and Graphing
Activity
Let's Play Ball
Lesson Plan
Let's Play Ball
Third Grade
Multiplication
Students will have a ball with this data collection lesson plan where they learn about collecting and plotting data on a chart and line plot.
Lesson Plan
Let's Play Ball
Lesson Plan
Let's Play Ball
Students will have a ball with this data collection lesson plan where they learn about collecting and plotting data on a chart and line plot.
Third Grade
Multiplication
Lesson Plan
Using a Chart: Do Your Chores!
Worksheet
Using a Chart: Do Your Chores!
Third Grade
Data and Graphing
Kids completing this third grade math worksheet use a chart to compare data and solve addition problems.
Worksheet
Using a Chart: Do Your Chores!
Worksheet
Using a Chart: Do Your Chores!
Kids completing this third grade math worksheet use a chart to compare data and solve addition problems.
Third Grade
Data and Graphing
Worksheet
Color Bar Graph
Game
Color Bar Graph
First Grade
Data and Graphing
Kids must help Cuz-Cuz and Birdee read bar graphs in this colorful data game.
Game
Color Bar Graph
Game
Color Bar Graph
Kids must help Cuz-Cuz and Birdee read bar graphs in this colorful data game.
First Grade
Data and Graphing
Game
1
2
3
4
…
9