SKIP TO CONTENT
Worksheet Generator
Subjects
Grades
Worksheets
Games
Build a Worksheet
More Resources
Roly Recommends
Subjects
Grades
Worksheets
Games
Build a Worksheet
More Resources
Roly Recommends
All Subjects
Math
Data and Graphing
Subtopics:
Collecting and Organizing Data
Picture Graphs
Bar Graphs
Show Less
Filters
Search for: simple, compound, and, complex, sentences, 0
✕
Math
✕
Common Core
✕
Subjects
Math
English Language Arts
Science
Social Studies
Grade Level
Pre-K
K
1st
2nd
3rd
4th
5th
6th
7th
8th
Early Childhood
Elementary School
Middle School
Resource Type
Worksheets
Lesson Plans
Workbooks
Activities
Common Core
Yes
English Language Support
Yes
See More
Clear All
View 25 results
Showing Results for simple compound and complex sentences 0
25 results
Search for: simple, compound, and, complex, sentences, 0
✕
Math
✕
Common Core
✕
Clear All
Sort by:
Relevance
Most recent
Most popular
Alphabetical A-Z
Alphabetical Z-A
All filters
25 results
Sort by:
Relevance
Most recent
Most popular
Alphabetical A-Z
Alphabetical Z-A
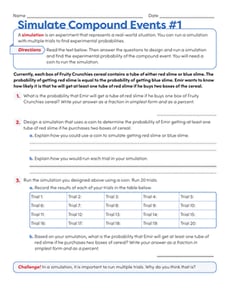
Simulate Compound Events #1
Worksheet
Simulate Compound Events #1
Seventh Grade
Data and Graphing
Practice designing a simulation for real-world compound events with this seventh-grade probability worksheet!
Worksheet
Simulate Compound Events #1
Worksheet
Simulate Compound Events #1
Practice designing a simulation for real-world compound events with this seventh-grade probability worksheet!
Seventh Grade
Data and Graphing
Worksheet
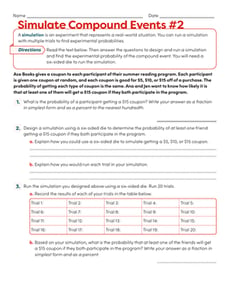
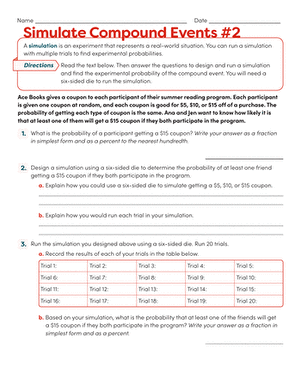
Simulate Compound Events #2
Worksheet
Simulate Compound Events #2
Seventh Grade
Data and Graphing
Give students additional practice designing and running a simulation to determine the probability of real-world compound events!
Worksheet
Simulate Compound Events #2
Worksheet
Simulate Compound Events #2
Give students additional practice designing and running a simulation to determine the probability of real-world compound events!
Seventh Grade
Data and Graphing
Worksheet
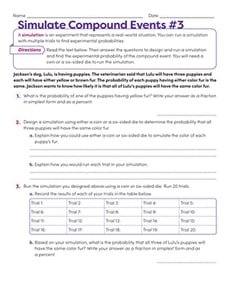
Simulate Compound Events #3
Worksheet
Simulate Compound Events #3
Seventh Grade
Data and Graphing
Give students more practice designing and running a simulation to determine the probability of real-world compound events!
Worksheet
Simulate Compound Events #3
Worksheet
Simulate Compound Events #3
Give students more practice designing and running a simulation to determine the probability of real-world compound events!
Seventh Grade
Data and Graphing
Worksheet
Sample Spaces of Compound Events
Worksheet
Sample Spaces of Compound Events
Seventh Grade
Data and Graphing
This seventh-grade math worksheet guides students through the process of finding the sample space of compound events.
Worksheet
Sample Spaces of Compound Events
Worksheet
Sample Spaces of Compound Events
This seventh-grade math worksheet guides students through the process of finding the sample space of compound events.
Seventh Grade
Data and Graphing
Worksheet
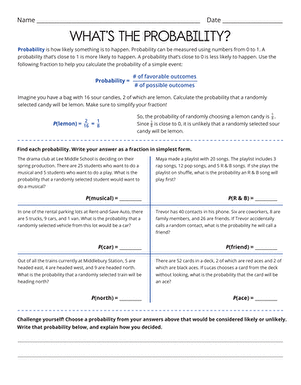
What's the Probability?
Worksheet
What's the Probability?
Seventh Grade
Data and Graphing
This math worksheet offers students hands-on practice in calculating probability through simple, familiar scenarios.
Worksheet
What's the Probability?
Worksheet
What's the Probability?
This math worksheet offers students hands-on practice in calculating probability through simple, familiar scenarios.
Seventh Grade
Data and Graphing
Worksheet
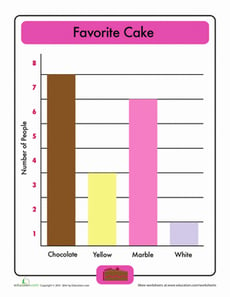
Beginning Bar Graphs: Favorite Cake
Worksheet
Beginning Bar Graphs: Favorite Cake
First Grade
Data and Graphing
This favorite cake bar graph makes reading bar graphs simple for kids to understand.
Worksheet
Beginning Bar Graphs: Favorite Cake
Worksheet
Beginning Bar Graphs: Favorite Cake
This favorite cake bar graph makes reading bar graphs simple for kids to understand.
First Grade
Data and Graphing
Worksheet
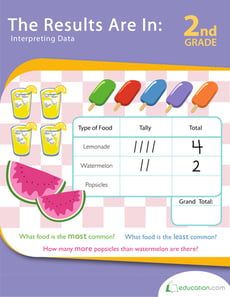
The Results Are In: Interpreting Data
Workbook
The Results Are In: Interpreting Data
Second Grade
Data and Graphing
Pictures and information go hand-in-hand in this workbook. Take a bite out of simple graphing and savor the math!
Workbook
The Results Are In: Interpreting Data
Workbook
The Results Are In: Interpreting Data
Pictures and information go hand-in-hand in this workbook. Take a bite out of simple graphing and savor the math!
Second Grade
Data and Graphing
Workbook
Flower Pie Chart
Worksheet
Flower Pie Chart
Second Grade
Data and Graphing
Even if your child isn't ready for statistics, he can learn to get his bearings around charts and graphs with this simple flower-themed pie chart worksheet.
Worksheet
Flower Pie Chart
Worksheet
Flower Pie Chart
Even if your child isn't ready for statistics, he can learn to get his bearings around charts and graphs with this simple flower-themed pie chart worksheet.
Second Grade
Data and Graphing
Worksheet
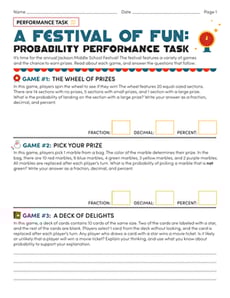
A Festival of Fun: Probability Performance Task
Worksheet
A Festival of Fun: Probability Performance Task
Seventh Grade
Data and Graphing
Students demonstrate their proficiency with probability in this three-page performance task worksheet!
Worksheet
A Festival of Fun: Probability Performance Task
Worksheet
A Festival of Fun: Probability Performance Task
Students demonstrate their proficiency with probability in this three-page performance task worksheet!
Seventh Grade
Data and Graphing
Worksheet
Probability Dice: Practice With Probability Models
Worksheet
Probability Dice: Practice With Probability Models
Seventh Grade
Data and Graphing
Probability can be as easy as rolling dice! What is the probability of rolling a 2? What about a 6? Practice calculating basic probability with this worksheet.
Worksheet
Probability Dice: Practice With Probability Models
Worksheet
Probability Dice: Practice With Probability Models
Probability can be as easy as rolling dice! What is the probability of rolling a 2? What about a 6? Practice calculating basic probability with this worksheet.
Seventh Grade
Data and Graphing
Worksheet
Backyard Bugs
Activity
Backyard Bugs
First Grade
Data and Graphing
Want to boost math and science learning? Take a bug expedition and give your first grader practice observing and charting what they see.
Activity
Backyard Bugs
Activity
Backyard Bugs
Want to boost math and science learning? Take a bug expedition and give your first grader practice observing and charting what they see.
First Grade
Data and Graphing
Activity
Interpreting Two-Way Frequency Tables
Worksheet
Interpreting Two-Way Frequency Tables
Eighth Grade
Data and Graphing
Students analyze two-way frequency tables in the context of relatable scenarios in this eighth-grade math worksheet!
Worksheet
Interpreting Two-Way Frequency Tables
Worksheet
Interpreting Two-Way Frequency Tables
Students analyze two-way frequency tables in the context of relatable scenarios in this eighth-grade math worksheet!
Eighth Grade
Data and Graphing
Worksheet
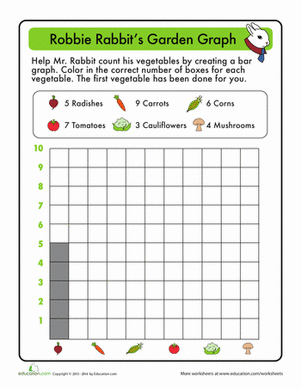
Garden Graphing
Worksheet
Garden Graphing
First Grade
Data and Graphing
Kids boost counting and graphing skills as they make a graph to illustrate the rabbit's garden vegetable pickings.
Worksheet
Garden Graphing
Worksheet
Garden Graphing
Kids boost counting and graphing skills as they make a graph to illustrate the rabbit's garden vegetable pickings.
First Grade
Data and Graphing
Worksheet
Reading Pictographs: Tomato Fest!
Worksheet
Reading Pictographs: Tomato Fest!
Third Grade
Data and Graphing
The farmers are busy picking tomatoes! Kids practice reading a pictograph to help Mr. Farmer figure out how many tomatoes he picked in this worksheet.
Worksheet
Reading Pictographs: Tomato Fest!
Worksheet
Reading Pictographs: Tomato Fest!
The farmers are busy picking tomatoes! Kids practice reading a pictograph to help Mr. Farmer figure out how many tomatoes he picked in this worksheet.
Third Grade
Data and Graphing
Worksheet
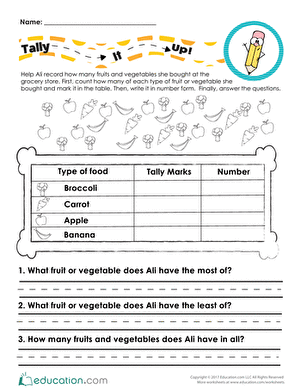
Tally It Up at the Grocery Store!
Worksheet
Tally It Up at the Grocery Store!
First Grade
Data and Graphing
Kids organize and tally up a grocery haul in this data worksheet.
Worksheet
Tally It Up at the Grocery Store!
Worksheet
Tally It Up at the Grocery Store!
Kids organize and tally up a grocery haul in this data worksheet.
First Grade
Data and Graphing
Worksheet
Circle What Belongs: Rainy Day
Worksheet
Circle What Belongs: Rainy Day
Pre-K
Data and Graphing
Which shoes are better for a rainy day, sandals or boots? This worksheet helps kids think critically about what things they see when the rain is pouring.
Worksheet
Circle What Belongs: Rainy Day
Worksheet
Circle What Belongs: Rainy Day
Which shoes are better for a rainy day, sandals or boots? This worksheet helps kids think critically about what things they see when the rain is pouring.
Pre-K
Data and Graphing
Worksheet
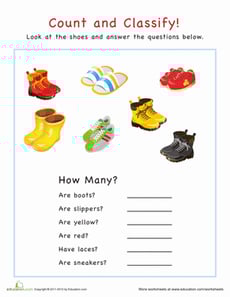
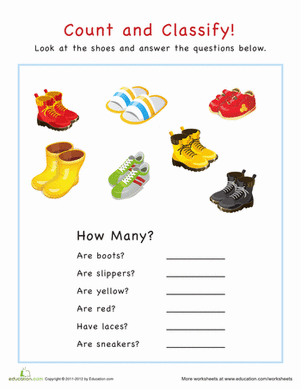
Count and Classify: Shoes
Worksheet
Count and Classify: Shoes
Pre-K
Numbers and Counting
Your shoe-obsessed child will learn how to count and classify his shoes in this worksheet. Count and classify with your child using these exercises.
Worksheet
Count and Classify: Shoes
Worksheet
Count and Classify: Shoes
Your shoe-obsessed child will learn how to count and classify his shoes in this worksheet. Count and classify with your child using these exercises.
Pre-K
Numbers and Counting
Worksheet
Bar Graphs: Favorite Color
Worksheet
Bar Graphs: Favorite Color
First Grade
Data and Graphing
Fill out a basic bar graph by polling students for their favorite color.
Worksheet
Bar Graphs: Favorite Color
Worksheet
Bar Graphs: Favorite Color
Fill out a basic bar graph by polling students for their favorite color.
First Grade
Data and Graphing
Worksheet
Winter Sports: Practice Reading a Bar Graph
Worksheet
Winter Sports: Practice Reading a Bar Graph
Second Grade
Data and Graphing
Children will practice interpreting a bar graph in this winter sports–themed math worksheet.
Worksheet
Winter Sports: Practice Reading a Bar Graph
Worksheet
Winter Sports: Practice Reading a Bar Graph
Children will practice interpreting a bar graph in this winter sports–themed math worksheet.
Second Grade
Data and Graphing
Worksheet
Graph Basics: Line Graphs
Worksheet
Graph Basics: Line Graphs
Third Grade
Data and Graphing
Learn how to read, analyze, and create a line graph with this helpful math worksheet!
Worksheet
Graph Basics: Line Graphs
Worksheet
Graph Basics: Line Graphs
Learn how to read, analyze, and create a line graph with this helpful math worksheet!
Third Grade
Data and Graphing
Worksheet
Why Do Leaves Change Color?
Activity
Why Do Leaves Change Color?
Second Grade
Data and Graphing
Engage your children with this fun fall activity that integrates math and science. First, your child will excavate to find leaves. Next, they'll examine them to determine the colors. Then, your child will graph their findings.
Activity
Why Do Leaves Change Color?
Activity
Why Do Leaves Change Color?
Engage your children with this fun fall activity that integrates math and science. First, your child will excavate to find leaves. Next, they'll examine them to determine the colors. Then, your child will graph their findings.
Second Grade
Data and Graphing
Activity
Math + Love = Valentine's Day Bar Graph
Lesson Plan
Math + Love = Valentine's Day Bar Graph
Second Grade
Data and Graphing
What's more romantic than a bar graph on Valentine's Day? In this Valentine's Day lesson plan, students will use information from a data set to create their own tally charts and bar graphs and then analyze these graphs to answer questions.
Lesson Plan
Math + Love = Valentine's Day Bar Graph
Lesson Plan
Math + Love = Valentine's Day Bar Graph
What's more romantic than a bar graph on Valentine's Day? In this Valentine's Day lesson plan, students will use information from a data set to create their own tally charts and bar graphs and then analyze these graphs to answer questions.
Second Grade
Data and Graphing
Lesson Plan
Mean, Median and Mode Madness!
Lesson Plan
Mean, Median and Mode Madness!
Third Grade
Data and Graphing
This lesson introduces students to the concepts of mean, median, and mode in a hands-on and visual way.
Lesson Plan
Mean, Median and Mode Madness!
Lesson Plan
Mean, Median and Mode Madness!
This lesson introduces students to the concepts of mean, median, and mode in a hands-on and visual way.
Third Grade
Data and Graphing
Lesson Plan
Bar Graphs: Interpreting Data
Lesson Plan
Bar Graphs: Interpreting Data
Second Grade
Data and Graphing
In this lesson, students will make bar graphs and interpret data using real-life data from other students. They will get practice writing and answering survey questions.
Lesson Plan
Bar Graphs: Interpreting Data
Lesson Plan
Bar Graphs: Interpreting Data
In this lesson, students will make bar graphs and interpret data using real-life data from other students. They will get practice writing and answering survey questions.
Second Grade
Data and Graphing
Lesson Plan
What is it Telling Me? Creating and Interpreting Line Plots
Lesson Plan
What is it Telling Me? Creating and Interpreting Line Plots
Third Grade
Data and Graphing
Line plots are a great way to introduce your students to graphing data. In this lesson, your students will learn how to create a line plot and also practice interpreting line plots.
Lesson Plan
What is it Telling Me? Creating and Interpreting Line Plots
Lesson Plan
What is it Telling Me? Creating and Interpreting Line Plots
Line plots are a great way to introduce your students to graphing data. In this lesson, your students will learn how to create a line plot and also practice interpreting line plots.
Third Grade
Data and Graphing
Lesson Plan
1