SKIP TO CONTENT
Worksheet Generator
Subjects
Grades
Worksheets
Games
Build a Worksheet
More Resources
Roly Recommends
Subjects
Grades
Worksheets
Games
Build a Worksheet
More Resources
Roly Recommends
All Subjects
Math
Data and Graphing
Subtopics:
Collecting and Organizing Data
Picture Graphs
Bar Graphs
Line Plots
Coordinate Plane
Box Plots
Histograms
Scatter Plots
Show Less
Filters
Search for: and, graphing, 1
✕
Math
✕
Common Core
✕
Subjects
Math
English Language Arts
Science
Social Studies
Grade Level
Pre-K
K
1st
2nd
3rd
4th
5th
6th
7th
8th
Early Childhood
Elementary School
Middle School
Resource Type
Worksheets
Games
Lesson Plans
Interactive Worksheets
Workbooks
Activities
Exercises
Offline Games
Teacher Resources
Occasion
Easter
Earth Day
Summer
Halloween
Holidays
Valentine's Day
Common Core
Yes
Game Type
Printable Board Games
English Language Support
Yes
See More
Clear All
View 161 results
Showing Results for and graphing 1 : Page 6
161 results
Search for: and, graphing, 1
✕
Math
✕
Common Core
✕
Clear All
Sort by:
Relevance
Most recent
Most popular
Alphabetical A-Z
Alphabetical Z-A
All filters
161 results
Sort by:
Relevance
Most recent
Most popular
Alphabetical A-Z
Alphabetical Z-A
Mean, Median and Mode Madness!
Lesson Plan
Mean, Median and Mode Madness!
Third Grade
Data and Graphing
This lesson introduces students to the concepts of mean, median, and mode in a hands-on and visual way.
Lesson Plan
Mean, Median and Mode Madness!
Lesson Plan
Mean, Median and Mode Madness!
This lesson introduces students to the concepts of mean, median, and mode in a hands-on and visual way.
Third Grade
Data and Graphing
Lesson Plan
Reading Pictographs: Eggplant Cooking
Worksheet
Reading Pictographs: Eggplant Cooking
Third Grade
Data and Graphing
Mr. Chef keeps track of how many eggplants he uses with a pictograph. In this worksheet, kids use information in the pictograph to answer word problems.
Worksheet
Reading Pictographs: Eggplant Cooking
Worksheet
Reading Pictographs: Eggplant Cooking
Mr. Chef keeps track of how many eggplants he uses with a pictograph. In this worksheet, kids use information in the pictograph to answer word problems.
Third Grade
Data and Graphing
Worksheet
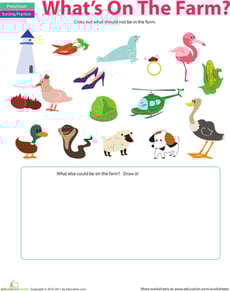
Sorting Activity: What Doesn't Belong?
Worksheet
Sorting Activity: What Doesn't Belong?
Pre-K
Data and Graphing
Can your preschooler solver this sorting activity? In this sorting worksheet, she'll use her logic to find the items and animals that don't belong.
Worksheet
Sorting Activity: What Doesn't Belong?
Worksheet
Sorting Activity: What Doesn't Belong?
Can your preschooler solver this sorting activity? In this sorting worksheet, she'll use her logic to find the items and animals that don't belong.
Pre-K
Data and Graphing
Worksheet
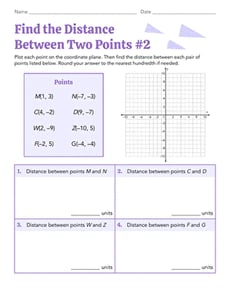
Find the Distance Between Two Points #2
Worksheet
Find the Distance Between Two Points #2
Eighth Grade
Geometry
Test your geometry skills and use the Pythagorean theorem in this eighth-grade worksheet!
Worksheet
Find the Distance Between Two Points #2
Worksheet
Find the Distance Between Two Points #2
Test your geometry skills and use the Pythagorean theorem in this eighth-grade worksheet!
Eighth Grade
Geometry
Worksheet
Box Plots #2
Interactive Worksheet
Box Plots #2
Sixth Grade
Data and Graphing
Sixth graders will learn all about interpreting box plots in this helpful worksheet!
Interactive Worksheet
Box Plots #2
Interactive Worksheet
Box Plots #2
Sixth graders will learn all about interpreting box plots in this helpful worksheet!
Sixth Grade
Data and Graphing
Interactive Worksheet
Build a Bar Graph: Favorite Wild Animals
Worksheet
Build a Bar Graph: Favorite Wild Animals
Second Grade
Data and Graphing
Analyze a bar graph with this second-grade worksheet!
Worksheet
Build a Bar Graph: Favorite Wild Animals
Worksheet
Build a Bar Graph: Favorite Wild Animals
Analyze a bar graph with this second-grade worksheet!
Second Grade
Data and Graphing
Worksheet
Creating Box Plots
Worksheet
Creating Box Plots
Sixth Grade
Data and Graphing
Learn to draw your own box plots to show data in this informative sixth-grade worksheet!
Worksheet
Creating Box Plots
Worksheet
Creating Box Plots
Learn to draw your own box plots to show data in this informative sixth-grade worksheet!
Sixth Grade
Data and Graphing
Worksheet
Find the Distance Between Two Points #3
Worksheet
Find the Distance Between Two Points #3
Eighth Grade
Geometry
Challenge yourself to calculate the distance between pairs of points on a coordinate plane with this essential geometry worksheet!
Worksheet
Find the Distance Between Two Points #3
Worksheet
Find the Distance Between Two Points #3
Challenge yourself to calculate the distance between pairs of points on a coordinate plane with this essential geometry worksheet!
Eighth Grade
Geometry
Worksheet
Nature Counting
Lesson Plan
Nature Counting
Kindergarten
Data and Graphing
Use this fun lesson plan to introduce or review the concept of addition to your ELs. Can be used as a stand alone or support lesson for the
Nature and Counting It All Adds Up
lesson plan.
Lesson Plan
Nature Counting
Lesson Plan
Nature Counting
Use this fun lesson plan to introduce or review the concept of addition to your ELs. Can be used as a stand alone or support lesson for the
Nature and Counting It All Adds Up
lesson plan.
Kindergarten
Data and Graphing
Lesson Plan
Interpreting Data Using Graphs
Lesson Plan
Interpreting Data Using Graphs
Kindergarten
Data and Graphing
Engage students in learning about data by analyzing picture graphs, then collecting data from classmates and making their own graphs!
Lesson Plan
Interpreting Data Using Graphs
Lesson Plan
Interpreting Data Using Graphs
Engage students in learning about data by analyzing picture graphs, then collecting data from classmates and making their own graphs!
Kindergarten
Data and Graphing
Lesson Plan
Bar Graphs: Interpreting Data
Lesson Plan
Bar Graphs: Interpreting Data
Second Grade
Data and Graphing
In this lesson, students will make bar graphs and interpret data using real-life data from other students. They will get practice writing and answering survey questions.
Lesson Plan
Bar Graphs: Interpreting Data
Lesson Plan
Bar Graphs: Interpreting Data
In this lesson, students will make bar graphs and interpret data using real-life data from other students. They will get practice writing and answering survey questions.
Second Grade
Data and Graphing
Lesson Plan
1
2
3
4
5
6