SKIP TO CONTENT
Worksheet Generator
Subjects
Grades
Worksheets
Games
Build a Worksheet
More Resources
Roly Recommends
Subjects
Grades
Worksheets
Games
Build a Worksheet
More Resources
Roly Recommends
All Subjects
Math
Data and Graphing
Subtopics:
Collecting and Organizing Data
Picture Graphs
Bar Graphs
Line Plots
Coordinate Plane
Box Plots
Histograms
Scatter Plots
Show Less
Filters
Search for: results, in, interpreting, data
✕
Math
✕
Common Core
✕
Subjects
Math
English Language Arts
Science
Social Studies
Grade Level
Pre-K
K
1st
2nd
3rd
4th
5th
6th
7th
8th
Early Childhood
Elementary School
Middle School
Resource Type
Worksheets
Games
Lesson Plans
Interactive Worksheets
Workbooks
Activities
Exercises
Occasion
Summer
Back to School
Halloween
Holidays
Valentine's Day
Common Core
Yes
English Language Support
Yes
See More
Clear All
View 158 results
Showing Results for results in interpreting data : Page 4
158 results
Search for: results, in, interpreting, data
✕
Math
✕
Common Core
✕
Clear All
Sort by:
Relevance
Most recent
Most popular
Alphabetical A-Z
Alphabetical Z-A
All filters
158 results
Sort by:
Relevance
Most recent
Most popular
Alphabetical A-Z
Alphabetical Z-A
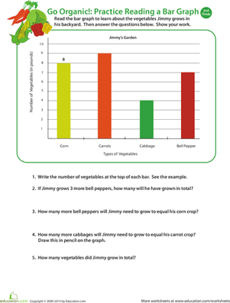
Go Organic! Practice Reading a Bar Graph
Worksheet
Go Organic! Practice Reading a Bar Graph
Second Grade
Data and Graphing
Boost your child's analytical thinking skills with this 2nd grade math worksheet in which he'll use data from a bar graph to answer word problems.
Worksheet
Go Organic! Practice Reading a Bar Graph
Worksheet
Go Organic! Practice Reading a Bar Graph
Boost your child's analytical thinking skills with this 2nd grade math worksheet in which he'll use data from a bar graph to answer word problems.
Second Grade
Data and Graphing
Worksheet
Graphing Favorite Pets
Worksheet
Graphing Favorite Pets
First Grade
Data and Graphing
Mix up math lessons with this pet-inspired graphing exercise. This is an interactive way to teach your students how to collect data and graph their findings.
Worksheet
Graphing Favorite Pets
Worksheet
Graphing Favorite Pets
Mix up math lessons with this pet-inspired graphing exercise. This is an interactive way to teach your students how to collect data and graph their findings.
First Grade
Data and Graphing
Worksheet
Dot Plots
Worksheet
Dot Plots
Sixth Grade
Data and Graphing
Covering a variety of interesting real-life contexts, this two-page math worksheet gives learners practice turning data sets into dot plots that are representative of each scenario.
Worksheet
Dot Plots
Worksheet
Dot Plots
Covering a variety of interesting real-life contexts, this two-page math worksheet gives learners practice turning data sets into dot plots that are representative of each scenario.
Sixth Grade
Data and Graphing
Worksheet
What Do We Know About Pets?
Worksheet
What Do We Know About Pets?
First Grade
Data and Graphing
Ms. Martin collected data about her class' favorite pets. Ask your students to use the bar graph with Ms. Martin's findings to answer the questions on the worksheet.
Worksheet
What Do We Know About Pets?
Worksheet
What Do We Know About Pets?
Ms. Martin collected data about her class' favorite pets. Ask your students to use the bar graph with Ms. Martin's findings to answer the questions on the worksheet.
First Grade
Data and Graphing
Worksheet
Graphing Favorite Fruits
Worksheet
Graphing Favorite Fruits
First Grade
Data and Graphing
Ask your students to survey their classmate's favorite fruits. Students will use this worksheet to record data by graphing the fruity answers they receive from classmates.
Worksheet
Graphing Favorite Fruits
Worksheet
Graphing Favorite Fruits
Ask your students to survey their classmate's favorite fruits. Students will use this worksheet to record data by graphing the fruity answers they receive from classmates.
First Grade
Data and Graphing
Worksheet
Graphing Colored Counters
Lesson Plan
Graphing Colored Counters
Kindergarten
Data and Graphing
In this lesson, your students will use the background knowledge that they have about counting and sorting to graph data. They will practice answering questions about the graph!
Lesson Plan
Graphing Colored Counters
Lesson Plan
Graphing Colored Counters
In this lesson, your students will use the background knowledge that they have about counting and sorting to graph data. They will practice answering questions about the graph!
Kindergarten
Data and Graphing
Lesson Plan
Practice Graphs
Worksheet
Practice Graphs
Second Grade
Data and Graphing
Kids practice representing a set of data using three kinds of graphs: a bar graph, pictograph, and pie graph.
Worksheet
Practice Graphs
Worksheet
Practice Graphs
Kids practice representing a set of data using three kinds of graphs: a bar graph, pictograph, and pie graph.
Second Grade
Data and Graphing
Worksheet
Scatter Plots
Worksheet
Scatter Plots
Eighth Grade
Data and Graphing
Students practice identifying outliers and the types of associations shown on scatter plots in this eighth-grade data and graphing worksheet!
Worksheet
Scatter Plots
Worksheet
Scatter Plots
Students practice identifying outliers and the types of associations shown on scatter plots in this eighth-grade data and graphing worksheet!
Eighth Grade
Data and Graphing
Worksheet
Interpreting Slopes and y-Intercepts of Lines of Best Fit
Worksheet
Interpreting Slopes and y-Intercepts of Lines of Best Fit
Eighth Grade
Algebra
Students interpret slopes and
y
-intercepts of lines of best fit based on real-world scenarios in this eighth-grade worksheet!
Worksheet
Interpreting Slopes and y-Intercepts of Lines of Best Fit
Worksheet
Interpreting Slopes and y-Intercepts of Lines of Best Fit
Students interpret slopes and
y
-intercepts of lines of best fit based on real-world scenarios in this eighth-grade worksheet!
Eighth Grade
Algebra
Worksheet
Math + Love = Valentine's Day Bar Graph
Lesson Plan
Math + Love = Valentine's Day Bar Graph
Second Grade
Data and Graphing
What's more romantic than a bar graph on Valentine's Day? In this Valentine's Day lesson plan, students will use information from a data set to create their own tally charts and bar graphs and then analyze these graphs to answer questions.
Lesson Plan
Math + Love = Valentine's Day Bar Graph
Lesson Plan
Math + Love = Valentine's Day Bar Graph
What's more romantic than a bar graph on Valentine's Day? In this Valentine's Day lesson plan, students will use information from a data set to create their own tally charts and bar graphs and then analyze these graphs to answer questions.
Second Grade
Data and Graphing
Lesson Plan
Making Comparative Inferences
Worksheet
Making Comparative Inferences
Seventh Grade
Data and Graphing
Give students practice creating box plots and making comparative inferences with this seventh-grade math worksheet!
Worksheet
Making Comparative Inferences
Worksheet
Making Comparative Inferences
Give students practice creating box plots and making comparative inferences with this seventh-grade math worksheet!
Seventh Grade
Data and Graphing
Worksheet
Math Table
Worksheet
Math Table
Second Grade
Data and Graphing
Help your second grader learn how to read a math table by using this math farm table to answer a set of questions.
Worksheet
Math Table
Worksheet
Math Table
Help your second grader learn how to read a math table by using this math farm table to answer a set of questions.
Second Grade
Data and Graphing
Worksheet
Comparing Pictographs: Football Time
Worksheet
Comparing Pictographs: Football Time
Third Grade
Data and Graphing
In this math worksheet, kids compare two pictographs that record the number of footballs kicked and the number of footballs thrown on the field.
Worksheet
Comparing Pictographs: Football Time
Worksheet
Comparing Pictographs: Football Time
In this math worksheet, kids compare two pictographs that record the number of footballs kicked and the number of footballs thrown on the field.
Third Grade
Data and Graphing
Worksheet
Reading Pictographs: Eggplant Cooking
Worksheet
Reading Pictographs: Eggplant Cooking
Third Grade
Data and Graphing
Mr. Chef keeps track of how many eggplants he uses with a pictograph. In this worksheet, kids use information in the pictograph to answer word problems.
Worksheet
Reading Pictographs: Eggplant Cooking
Worksheet
Reading Pictographs: Eggplant Cooking
Mr. Chef keeps track of how many eggplants he uses with a pictograph. In this worksheet, kids use information in the pictograph to answer word problems.
Third Grade
Data and Graphing
Worksheet
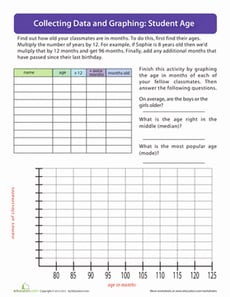
Student Age
Worksheet
Student Age
Third Grade
Data and Graphing
Get to know your classmates with a fun polling and graphing activity. Kids will use their math skills to find the ages of their classmates in months.
Worksheet
Student Age
Worksheet
Student Age
Get to know your classmates with a fun polling and graphing activity. Kids will use their math skills to find the ages of their classmates in months.
Third Grade
Data and Graphing
Worksheet
Graph It! What is Your Favorite Holiday?
Worksheet
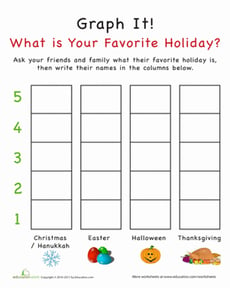
Graph It! What is Your Favorite Holiday?
Kindergarten
Data and Graphing
Help your child conduct a study, all about his friends' favorite holidays. Our holiday graphing worksheet is a fun way to show your kid practical uses for math.
Worksheet
Graph It! What is Your Favorite Holiday?
Worksheet
Graph It! What is Your Favorite Holiday?
Help your child conduct a study, all about his friends' favorite holidays. Our holiday graphing worksheet is a fun way to show your kid practical uses for math.
Kindergarten
Data and Graphing
Worksheet
Coin Toss Probability
Worksheet
Coin Toss Probability
Fifth Grade
Data and Graphing
We all know a coin toss gives you a 50% chance of winning, but is it always that way? Delve into the inner-workings of coin toss probability with this activity.
Worksheet
Coin Toss Probability
Worksheet
Coin Toss Probability
We all know a coin toss gives you a 50% chance of winning, but is it always that way? Delve into the inner-workings of coin toss probability with this activity.
Fifth Grade
Data and Graphing
Worksheet
Scaled Picture Graphs
Exercise
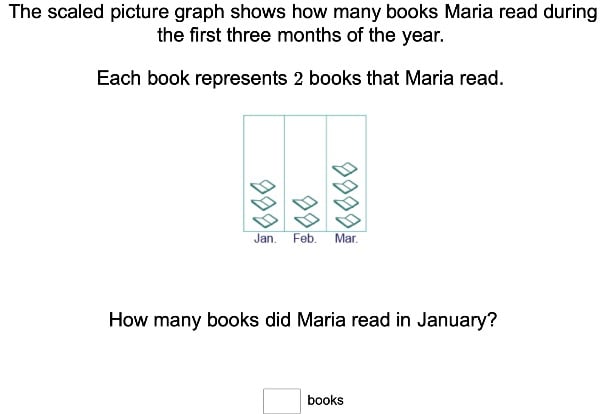
Scaled Picture Graphs
Third Grade
Data and Graphing
For amateur mathematicians, this exercise will incorporate neat pictures into math time with scaled picture graphs.
Exercise
Scaled Picture Graphs
Exercise
Scaled Picture Graphs
For amateur mathematicians, this exercise will incorporate neat pictures into math time with scaled picture graphs.
Third Grade
Data and Graphing
Exercise
Reading Pictographs: Carrots for Bunnies
Worksheet
Reading Pictographs: Carrots for Bunnies
Third Grade
Data and Graphing
How many carrots did Sammy's pet bunny eat? Kids use information in the pictograph to answer word problems in this bunny-filled math worksheet.
Worksheet
Reading Pictographs: Carrots for Bunnies
Worksheet
Reading Pictographs: Carrots for Bunnies
How many carrots did Sammy's pet bunny eat? Kids use information in the pictograph to answer word problems in this bunny-filled math worksheet.
Third Grade
Data and Graphing
Worksheet
Make Predictions Using Experimental Probability
Interactive Worksheet
Make Predictions Using Experimental Probability
Seventh Grade
Data and Graphing
In this seventh-grade probability worksheet, students are introduced to the concept of experimental probability and shown how to use this information to make predictions.
Interactive Worksheet
Make Predictions Using Experimental Probability
Interactive Worksheet
Make Predictions Using Experimental Probability
In this seventh-grade probability worksheet, students are introduced to the concept of experimental probability and shown how to use this information to make predictions.
Seventh Grade
Data and Graphing
Interactive Worksheet
Reading Pictographs: Tomato Fest!
Worksheet
Reading Pictographs: Tomato Fest!
Third Grade
Data and Graphing
The farmers are busy picking tomatoes! Kids practice reading a pictograph to help Mr. Farmer figure out how many tomatoes he picked in this worksheet.
Worksheet
Reading Pictographs: Tomato Fest!
Worksheet
Reading Pictographs: Tomato Fest!
The farmers are busy picking tomatoes! Kids practice reading a pictograph to help Mr. Farmer figure out how many tomatoes he picked in this worksheet.
Third Grade
Data and Graphing
Worksheet
Build a Bar Graph: Favorite Wild Animals
Worksheet
Build a Bar Graph: Favorite Wild Animals
Second Grade
Data and Graphing
Analyze a bar graph with this second-grade worksheet!
Worksheet
Build a Bar Graph: Favorite Wild Animals
Worksheet
Build a Bar Graph: Favorite Wild Animals
Analyze a bar graph with this second-grade worksheet!
Second Grade
Data and Graphing
Worksheet
Graph Proportional Relationships #2
Worksheet
Graph Proportional Relationships #2
Eighth Grade
Ratios and Proportions
Students practice graphing proportional relationships based on relatable word problems in this eighth-grade math worksheet!
Worksheet
Graph Proportional Relationships #2
Worksheet
Graph Proportional Relationships #2
Students practice graphing proportional relationships based on relatable word problems in this eighth-grade math worksheet!
Eighth Grade
Ratios and Proportions
Worksheet
Reading a Bar Graph: Number of Athletes
Worksheet
Reading a Bar Graph: Number of Athletes
Third Grade
Data and Graphing
In this sports-themed worksheet, children use a bar graph to answer six questions about the number of athletes playing at a time in a variety of sporting events.
Worksheet
Reading a Bar Graph: Number of Athletes
Worksheet
Reading a Bar Graph: Number of Athletes
In this sports-themed worksheet, children use a bar graph to answer six questions about the number of athletes playing at a time in a variety of sporting events.
Third Grade
Data and Graphing
Worksheet
Picture Graphing with Fish
Game
Picture Graphing with Fish
Third Grade
Data and Graphing
Fish, fish everywhere! Kids catch fish to sort and graph in this zany game.
Game
Picture Graphing with Fish
Game
Picture Graphing with Fish
Fish, fish everywhere! Kids catch fish to sort and graph in this zany game.
Third Grade
Data and Graphing
Game
Constructing Two-Way Relative Frequency Tables
Interactive Worksheet
Constructing Two-Way Relative Frequency Tables
Eighth Grade
Data and Graphing
Practice creating two-way relative frequency tables based on real-world scenarios with this eighth-grade math worksheet!
Interactive Worksheet
Constructing Two-Way Relative Frequency Tables
Interactive Worksheet
Constructing Two-Way Relative Frequency Tables
Practice creating two-way relative frequency tables based on real-world scenarios with this eighth-grade math worksheet!
Eighth Grade
Data and Graphing
Interactive Worksheet
Graph My Design
Worksheet
Graph My Design
First Grade
Data and Graphing
Students build a design and then use this bar graph to show how many of each shape was used. Place inside a sheet protector to reuse.
Worksheet
Graph My Design
Worksheet
Graph My Design
Students build a design and then use this bar graph to show how many of each shape was used. Place inside a sheet protector to reuse.
First Grade
Data and Graphing
Worksheet
Describing Distributions in Dot Plots
Worksheet
Describing Distributions in Dot Plots
Sixth Grade
Data and Graphing
Students explore distributions in dot plots with this sixth-grade statistics worksheet!
Worksheet
Describing Distributions in Dot Plots
Worksheet
Describing Distributions in Dot Plots
Students explore distributions in dot plots with this sixth-grade statistics worksheet!
Sixth Grade
Data and Graphing
Worksheet
Graph It! How Many Siblings Do You Have?
Worksheet
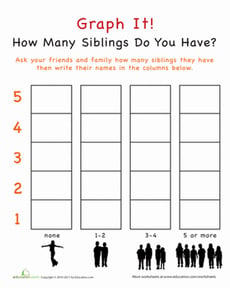
Graph It! How Many Siblings Do You Have?
Kindergarten
Data and Graphing
Use this Graph It! worksheet to show your child the practical side of math. This graphing exercise gets your child to survey his friends on their siblings.
Worksheet
Graph It! How Many Siblings Do You Have?
Worksheet
Graph It! How Many Siblings Do You Have?
Use this Graph It! worksheet to show your child the practical side of math. This graphing exercise gets your child to survey his friends on their siblings.
Kindergarten
Data and Graphing
Worksheet
Graph Practice
Interactive Worksheet
Graph Practice
Second Grade
Data and Graphing
Don't let your second grader forget graphs! Be sure to review how to read a bar graph and pictograph with help from this handy worksheet. Challenge your young mathematician to read the graphs and answer some questions.
Interactive Worksheet
Graph Practice
Interactive Worksheet
Graph Practice
Don't let your second grader forget graphs! Be sure to review how to read a bar graph and pictograph with help from this handy worksheet. Challenge your young mathematician to read the graphs and answer some questions.
Second Grade
Data and Graphing
Interactive Worksheet
1
2
3
4
5
6