SKIP TO CONTENT
Worksheet Generator
Subjects
Grades
Worksheets
Games
Build a Worksheet
More Resources
Roly Recommends
Subjects
Grades
Worksheets
Games
Build a Worksheet
More Resources
Roly Recommends
All Subjects
Math
Data and Graphing
Subtopics:
Collecting and Organizing Data
Picture Graphs
Bar Graphs
Line Plots
Coordinate Plane
Box Plots
Histograms
Scatter Plots
Show Less
Filters
Search for: three, digit, and, two, step, word, problems
✕
Math
✕
Common Core
✕
Subjects
Math
English Language Arts
Science
Social Studies
Grade Level
Pre-K
K
1st
2nd
3rd
4th
5th
6th
7th
8th
Early Childhood
Elementary School
Middle School
Resource Type
Worksheets
Games
Lesson Plans
Interactive Worksheets
Workbooks
Exercises
Offline Games
Teacher Resources
Occasion
Back to School
Halloween
Holidays
Common Core
Yes
Game Type
Printable Board Games
English Language Support
Yes
See More
Clear All
View 125 results
Showing Results for three digit and two step word problems : Page 3
125 results
Search for: three, digit, and, two, step, word, problems
✕
Math
✕
Common Core
✕
Clear All
Sort by:
Relevance
Most recent
Most popular
Alphabetical A-Z
Alphabetical Z-A
All filters
125 results
Sort by:
Relevance
Most recent
Most popular
Alphabetical A-Z
Alphabetical Z-A
Animal Shape-Up
Worksheet
Animal Shape-Up
Kindergarten
Data and Graphing
This worksheet will strengthen your kindergarteners observational skills and vocabulary as they use words from a word bank to describe different animals.
Worksheet
Animal Shape-Up
Worksheet
Animal Shape-Up
This worksheet will strengthen your kindergarteners observational skills and vocabulary as they use words from a word bank to describe different animals.
Kindergarten
Data and Graphing
Worksheet
One of These Things Is Not Like The Other One (Part Three)
Worksheet
One of These Things Is Not Like The Other One (Part Three)
Kindergarten
Data and Graphing
With this worksheet, your students will have fun circling the objects that do not belong with the others.
Worksheet
One of These Things Is Not Like The Other One (Part Three)
Worksheet
One of These Things Is Not Like The Other One (Part Three)
With this worksheet, your students will have fun circling the objects that do not belong with the others.
Kindergarten
Data and Graphing
Worksheet
Scaled Bar Graphs
Exercise
Scaled Bar Graphs
Third Grade
Data and Graphing
This exercise will clarify just how scaled bar graphs represent data found in math problems.
Exercise
Scaled Bar Graphs
Exercise
Scaled Bar Graphs
This exercise will clarify just how scaled bar graphs represent data found in math problems.
Third Grade
Data and Graphing
Exercise
Bar Graph: Getting to School
Worksheet
Bar Graph: Getting to School
Third Grade
Data and Graphing
Kids completing this third grade math worksheet use a bar graph to compare data about transportation to school and solve addition and subtraction problems.
Worksheet
Bar Graph: Getting to School
Worksheet
Bar Graph: Getting to School
Kids completing this third grade math worksheet use a bar graph to compare data about transportation to school and solve addition and subtraction problems.
Third Grade
Data and Graphing
Worksheet
One of These Things Is Not Like The Other One (Part Two)
Worksheet
One of These Things Is Not Like The Other One (Part Two)
Kindergarten
Data and Graphing
Your students will have fun looking at the pictures in each row and deciding which item is not like the others.
Worksheet
One of These Things Is Not Like The Other One (Part Two)
Worksheet
One of These Things Is Not Like The Other One (Part Two)
Your students will have fun looking at the pictures in each row and deciding which item is not like the others.
Kindergarten
Data and Graphing
Worksheet
Basic Pictographs
Worksheet
Basic Pictographs
First Grade
Data and Graphing
Practice adding multiple digits with a fun pictograph page. Use the chart to draw out the number of items in each problem.
Worksheet
Basic Pictographs
Worksheet
Basic Pictographs
Practice adding multiple digits with a fun pictograph page. Use the chart to draw out the number of items in each problem.
First Grade
Data and Graphing
Worksheet
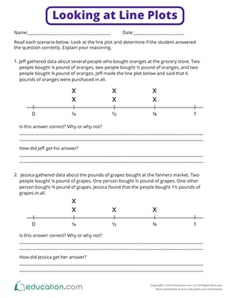
Looking at Line Plots
Worksheet
Looking at Line Plots
Fifth Grade
Fractions
This worksheet prompts students' critical thinking skills. Students will need to determine if several line plot problems are solved correctly and explain their reasoning.
Worksheet
Looking at Line Plots
Worksheet
Looking at Line Plots
This worksheet prompts students' critical thinking skills. Students will need to determine if several line plot problems are solved correctly and explain their reasoning.
Fifth Grade
Fractions
Worksheet
Addition Picture Graphs
Worksheet
Addition Picture Graphs
First Grade
Data and Graphing
Explore some stellar math concepts with this worksheet on adding multiple digits. Fill in the pictograph to help you visualize the problem first.
Worksheet
Addition Picture Graphs
Worksheet
Addition Picture Graphs
Explore some stellar math concepts with this worksheet on adding multiple digits. Fill in the pictograph to help you visualize the problem first.
First Grade
Data and Graphing
Worksheet
Graph Proportional Relationships #1
Worksheet
Graph Proportional Relationships #1
Eighth Grade
Ratios and Proportions
Help learners connect the constant of proportionality with the slope of a line in this one-page graphing worksheet!
Worksheet
Graph Proportional Relationships #1
Worksheet
Graph Proportional Relationships #1
Help learners connect the constant of proportionality with the slope of a line in this one-page graphing worksheet!
Eighth Grade
Ratios and Proportions
Worksheet
Graphing Proportional Relationships
Worksheet
Graphing Proportional Relationships
Eighth Grade
Ratios and Proportions
Practice graphing proportional relationships and finding the constant of proportionality with this eighth-grade math worksheet!
Worksheet
Graphing Proportional Relationships
Worksheet
Graphing Proportional Relationships
Practice graphing proportional relationships and finding the constant of proportionality with this eighth-grade math worksheet!
Eighth Grade
Ratios and Proportions
Worksheet
From Dot Plots to Histograms
Worksheet
From Dot Plots to Histograms
Sixth Grade
Data and Graphing
Discover different ways to display data in this delightful sixth-grade worksheet!
Worksheet
From Dot Plots to Histograms
Worksheet
From Dot Plots to Histograms
Discover different ways to display data in this delightful sixth-grade worksheet!
Sixth Grade
Data and Graphing
Worksheet
Drawing Inferences Using Data
Worksheet
Drawing Inferences Using Data
Seventh Grade
Data and Graphing
Students compare different survey methods to make inferences about how much time students at a school spend playing video games in this seventh-grade math worksheet.
Worksheet
Drawing Inferences Using Data
Worksheet
Drawing Inferences Using Data
Students compare different survey methods to make inferences about how much time students at a school spend playing video games in this seventh-grade math worksheet.
Seventh Grade
Data and Graphing
Worksheet
Reading Pictographs: Going to the Theater
Worksheet
Reading Pictographs: Going to the Theater
Third Grade
Data and Graphing
In this 3rd grade math worksheet, kids practice interpreting graph data as they use the information in a pictograph to answer a set of questions.
Worksheet
Reading Pictographs: Going to the Theater
Worksheet
Reading Pictographs: Going to the Theater
In this 3rd grade math worksheet, kids practice interpreting graph data as they use the information in a pictograph to answer a set of questions.
Third Grade
Data and Graphing
Worksheet
Creating Histograms From Frequency Tables
Worksheet
Creating Histograms From Frequency Tables
Sixth Grade
Data and Graphing
Practice using histograms to show different sets of data in this engaging sixth-grade worksheet!
Worksheet
Creating Histograms From Frequency Tables
Worksheet
Creating Histograms From Frequency Tables
Practice using histograms to show different sets of data in this engaging sixth-grade worksheet!
Sixth Grade
Data and Graphing
Worksheet
Reading Pictographs: Tomato Fest!
Worksheet
Reading Pictographs: Tomato Fest!
Third Grade
Data and Graphing
The farmers are busy picking tomatoes! Kids practice reading a pictograph to help Mr. Farmer figure out how many tomatoes he picked in this worksheet.
Worksheet
Reading Pictographs: Tomato Fest!
Worksheet
Reading Pictographs: Tomato Fest!
The farmers are busy picking tomatoes! Kids practice reading a pictograph to help Mr. Farmer figure out how many tomatoes he picked in this worksheet.
Third Grade
Data and Graphing
Worksheet
Less Than or Greater Than: 1 to 20
Game
Less Than or Greater Than: 1 to 20
First Grade
Numbers and Counting
The alligators are hungry for numbers, and kids use number skills to feed them.
Game
Less Than or Greater Than: 1 to 20
Game
Less Than or Greater Than: 1 to 20
The alligators are hungry for numbers, and kids use number skills to feed them.
First Grade
Numbers and Counting
Game
Go Runners! Practice Reading a Bar Graph
Worksheet
Go Runners! Practice Reading a Bar Graph
Third Grade
Data and Graphing
Your child will practice reading and interpreting a bar graph and using its data to answer a set of questions in this 3rd grade math worksheet.
Worksheet
Go Runners! Practice Reading a Bar Graph
Worksheet
Go Runners! Practice Reading a Bar Graph
Your child will practice reading and interpreting a bar graph and using its data to answer a set of questions in this 3rd grade math worksheet.
Third Grade
Data and Graphing
Worksheet
Juice Time: Practice Reading a Bar Graph
Worksheet
Juice Time: Practice Reading a Bar Graph
Third Grade
Data and Graphing
In this 3rd grade math worksheet, your child will practice reading a bar graph about juice and interpreting its information to answer a set of questions.
Worksheet
Juice Time: Practice Reading a Bar Graph
Worksheet
Juice Time: Practice Reading a Bar Graph
In this 3rd grade math worksheet, your child will practice reading a bar graph about juice and interpreting its information to answer a set of questions.
Third Grade
Data and Graphing
Worksheet
Make a Picture Graph
Worksheet
Make a Picture Graph
First Grade
Data and Graphing
In this math worksheet, children use picture graphs to tally up the total amounts of baked goods each party purchases.
Worksheet
Make a Picture Graph
Worksheet
Make a Picture Graph
In this math worksheet, children use picture graphs to tally up the total amounts of baked goods each party purchases.
First Grade
Data and Graphing
Worksheet
Reading Pictographs: Drink Your Milk!
Worksheet
Reading Pictographs: Drink Your Milk!
Third Grade
Data and Graphing
Can your child help Tommy figure out how much milk he drinks? As she does, she'll learn how to read and interpret data in graphs and practice multiplication.
Worksheet
Reading Pictographs: Drink Your Milk!
Worksheet
Reading Pictographs: Drink Your Milk!
Can your child help Tommy figure out how much milk he drinks? As she does, she'll learn how to read and interpret data in graphs and practice multiplication.
Third Grade
Data and Graphing
Worksheet
Sample Spaces of Compound Events
Worksheet
Sample Spaces of Compound Events
Seventh Grade
Data and Graphing
This seventh-grade math worksheet guides students through the process of finding the sample space of compound events.
Worksheet
Sample Spaces of Compound Events
Worksheet
Sample Spaces of Compound Events
This seventh-grade math worksheet guides students through the process of finding the sample space of compound events.
Seventh Grade
Data and Graphing
Worksheet
What Do We Know About Pets?
Worksheet
What Do We Know About Pets?
First Grade
Data and Graphing
Ms. Martin collected data about her class' favorite pets. Ask your students to use the bar graph with Ms. Martin's findings to answer the questions on the worksheet.
Worksheet
What Do We Know About Pets?
Worksheet
What Do We Know About Pets?
Ms. Martin collected data about her class' favorite pets. Ask your students to use the bar graph with Ms. Martin's findings to answer the questions on the worksheet.
First Grade
Data and Graphing
Worksheet
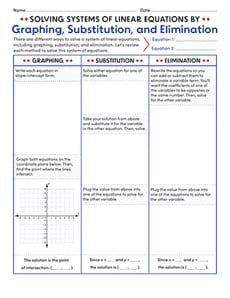
Solving Systems of Linear Equations By Graphing, Substitution, and Elimination Guided Notes
Worksheet
Solving Systems of Linear Equations By Graphing, Substitution, and Elimination Guided Notes
Eighth Grade
Algebra
Use these guided notes to give students confidence in solving systems of equations using graphing, substitution, and elimination methods!
Worksheet
Solving Systems of Linear Equations By Graphing, Substitution, and Elimination Guided Notes
Worksheet
Solving Systems of Linear Equations By Graphing, Substitution, and Elimination Guided Notes
Use these guided notes to give students confidence in solving systems of equations using graphing, substitution, and elimination methods!
Eighth Grade
Algebra
Worksheet
2D and 3D Shape Sort: Factory
Game
2D and 3D Shape Sort: Factory
Kindergarten
Geometry
Kids sort 2D and 3D shapes in this engaging geometry game.
Game
2D and 3D Shape Sort: Factory
Game
2D and 3D Shape Sort: Factory
Kids sort 2D and 3D shapes in this engaging geometry game.
Kindergarten
Geometry
Game
Nature Counting
Lesson Plan
Nature Counting
Kindergarten
Data and Graphing
Use this fun lesson plan to introduce or review the concept of addition to your ELs. Can be used as a stand alone or support lesson for the
Nature and Counting It All Adds Up
lesson plan.
Lesson Plan
Nature Counting
Lesson Plan
Nature Counting
Use this fun lesson plan to introduce or review the concept of addition to your ELs. Can be used as a stand alone or support lesson for the
Nature and Counting It All Adds Up
lesson plan.
Kindergarten
Data and Graphing
Lesson Plan
Creating Box Plots
Worksheet
Creating Box Plots
Sixth Grade
Data and Graphing
Learn to draw your own box plots to show data in this informative sixth-grade worksheet!
Worksheet
Creating Box Plots
Worksheet
Creating Box Plots
Learn to draw your own box plots to show data in this informative sixth-grade worksheet!
Sixth Grade
Data and Graphing
Worksheet
Estimating Lines of Best Fit
Worksheet
Estimating Lines of Best Fit
Eighth Grade
Data and Graphing
Students estimate and sketch lines of best fit on various scatter plots and describe the association displayed on each.
Worksheet
Estimating Lines of Best Fit
Worksheet
Estimating Lines of Best Fit
Students estimate and sketch lines of best fit on various scatter plots and describe the association displayed on each.
Eighth Grade
Data and Graphing
Worksheet
Pictographs: Say Cheese!
Worksheet
Pictographs: Say Cheese!
Third Grade
Data and Graphing
To keep track of his cheese sales, Giovanni uses a pictograph. Kids will figure out how his cheese business is doing by using data in the graph.
Worksheet
Pictographs: Say Cheese!
Worksheet
Pictographs: Say Cheese!
To keep track of his cheese sales, Giovanni uses a pictograph. Kids will figure out how his cheese business is doing by using data in the graph.
Third Grade
Data and Graphing
Worksheet
Winter Sports: Practice Reading a Bar Graph
Worksheet
Winter Sports: Practice Reading a Bar Graph
Second Grade
Data and Graphing
Children will practice interpreting a bar graph in this winter sports–themed math worksheet.
Worksheet
Winter Sports: Practice Reading a Bar Graph
Worksheet
Winter Sports: Practice Reading a Bar Graph
Children will practice interpreting a bar graph in this winter sports–themed math worksheet.
Second Grade
Data and Graphing
Worksheet
Let's Graph Our Fall Favorites!
Lesson Plan
Let's Graph Our Fall Favorites!
Second Grade
Data and Graphing
This engaging math lesson combines all of your kid's fall favorites as they learn to represent data using a bar graph.
Lesson Plan
Let's Graph Our Fall Favorites!
Lesson Plan
Let's Graph Our Fall Favorites!
This engaging math lesson combines all of your kid's fall favorites as they learn to represent data using a bar graph.
Second Grade
Data and Graphing
Lesson Plan
1
2
3
4
5