SKIP TO CONTENT
Worksheet Generator
Subjects
Grades
Worksheets
Games
Build a Worksheet
More Resources
Roly Recommends
Reading Month
Subjects
Grades
Worksheets
Games
Build a Worksheet
More Resources
Roly Recommends
Reading Month
All Subjects
Math
Data and Graphing
Subtopics:
Collecting and Organizing Data
Picture Graphs
Bar Graphs
Line Plots
Coordinate Plane
Box Plots
Histograms
Scatter Plots
Show Less
Filters
Search for: building, fluency, grade, 1
✕
Math
✕
Common Core
✕
Subjects
Math
English Language Arts
Science
Social Studies
Grade Level
Pre-K
K
1st
2nd
3rd
4th
5th
6th
7th
8th
Early Childhood
Elementary School
Middle School
Resource Type
Worksheets
Games
Lesson Plans
Interactive Worksheets
Activities
Exercises
Offline Games
Teacher Resources
Occasion
Easter
Earth Day
Summer
Back to School
Halloween
Holidays
Valentine's Day
Common Core
Yes
Game Type
Printable Board Games
English Language Support
Yes
See More
Clear All
View 173 results
Showing Results for building fluency grade 1 : Page 2
173 results
Search for: building, fluency, grade, 1
✕
Math
✕
Common Core
✕
Clear All
Sort by:
Relevance
Most recent
Most popular
Alphabetical A-Z
Alphabetical Z-A
All filters
173 results
Sort by:
Relevance
Most recent
Most popular
Alphabetical A-Z
Alphabetical Z-A
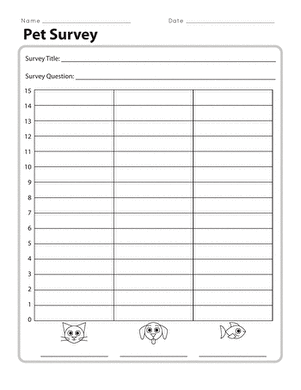
Pet Survey
Worksheet
Pet Survey
First Grade
Data and Graphing
Have your students survey one another about pet preferences using this interactive activity designed to practice representing and interpreting data.
Worksheet
Pet Survey
Worksheet
Pet Survey
Have your students survey one another about pet preferences using this interactive activity designed to practice representing and interpreting data.
First Grade
Data and Graphing
Worksheet
Interpreting Line Plots with Fractional Units
Worksheet
Interpreting Line Plots with Fractional Units
Third Grade
Data and Graphing
In this third grade worksheet, kids will interpret a line plot that includes fractional units.
Worksheet
Interpreting Line Plots with Fractional Units
Worksheet
Interpreting Line Plots with Fractional Units
In this third grade worksheet, kids will interpret a line plot that includes fractional units.
Third Grade
Data and Graphing
Worksheet
Creating Box Plots
Worksheet
Creating Box Plots
Sixth Grade
Data and Graphing
Learn to draw your own box plots to show data in this informative sixth-grade worksheet!
Worksheet
Creating Box Plots
Worksheet
Creating Box Plots
Learn to draw your own box plots to show data in this informative sixth-grade worksheet!
Sixth Grade
Data and Graphing
Worksheet
Comparing Pictographs: Taxi, Taxi
Worksheet
Comparing Pictographs: Taxi, Taxi
Third Grade
Addition
In this 3rd grade math worksheet, kids analyze and compare data in two pictographs in order to answer a set of word problems.
Worksheet
Comparing Pictographs: Taxi, Taxi
Worksheet
Comparing Pictographs: Taxi, Taxi
In this 3rd grade math worksheet, kids analyze and compare data in two pictographs in order to answer a set of word problems.
Third Grade
Addition
Worksheet
Easter Shapes
Worksheet
Easter Shapes
Kindergarten
Geometry
Treat your little one to an Easter shape hunt! She'll practice identifying geometric shapes and categorizing them by coloring each shape a different color.
Worksheet
Easter Shapes
Worksheet
Easter Shapes
Treat your little one to an Easter shape hunt! She'll practice identifying geometric shapes and categorizing them by coloring each shape a different color.
Kindergarten
Geometry
Worksheet
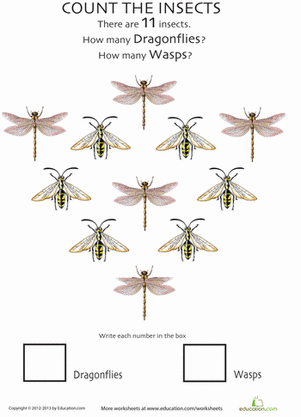
Insect Counting Worksheet: Wasps and Dragonflies
Worksheet
Insect Counting Worksheet: Wasps and Dragonflies
Kindergarten
Numbers and Counting
Give your kindergartener plenty of counting practice. This counting worksheet, featuring wasps and dragonflies, may even turn your young one into a bug fanatic.
Worksheet
Insect Counting Worksheet: Wasps and Dragonflies
Worksheet
Insect Counting Worksheet: Wasps and Dragonflies
Give your kindergartener plenty of counting practice. This counting worksheet, featuring wasps and dragonflies, may even turn your young one into a bug fanatic.
Kindergarten
Numbers and Counting
Worksheet
Creating Histograms From Frequency Tables
Worksheet
Creating Histograms From Frequency Tables
Sixth Grade
Data and Graphing
Practice using histograms to show different sets of data in this engaging sixth-grade worksheet!
Worksheet
Creating Histograms From Frequency Tables
Worksheet
Creating Histograms From Frequency Tables
Practice using histograms to show different sets of data in this engaging sixth-grade worksheet!
Sixth Grade
Data and Graphing
Worksheet
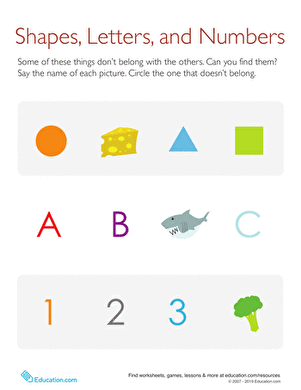
What Doesn't Belong?: Shapes, Letters, and Numbers
Worksheet
What Doesn't Belong?: Shapes, Letters, and Numbers
Pre-K
Data and Graphing
Circle, cheese, triangle, square: One of these things does not belong in this group. Help your child figure out the outlying object with this worksheet.
Worksheet
What Doesn't Belong?: Shapes, Letters, and Numbers
Worksheet
What Doesn't Belong?: Shapes, Letters, and Numbers
Circle, cheese, triangle, square: One of these things does not belong in this group. Help your child figure out the outlying object with this worksheet.
Pre-K
Data and Graphing
Worksheet
Experimental Probability Models
Worksheet
Experimental Probability Models
Seventh Grade
Data and Graphing
Use this seventh-grade math worksheet to introduce students to the concept of experimental probability models.
Worksheet
Experimental Probability Models
Worksheet
Experimental Probability Models
Use this seventh-grade math worksheet to introduce students to the concept of experimental probability models.
Seventh Grade
Data and Graphing
Worksheet
Making Comparative Inferences
Worksheet
Making Comparative Inferences
Seventh Grade
Data and Graphing
Give students practice creating box plots and making comparative inferences with this seventh-grade math worksheet!
Worksheet
Making Comparative Inferences
Worksheet
Making Comparative Inferences
Give students practice creating box plots and making comparative inferences with this seventh-grade math worksheet!
Seventh Grade
Data and Graphing
Worksheet
Constructing Scatter Plots
Worksheet
Constructing Scatter Plots
Eighth Grade
Data and Graphing
Get students creating scatter plots using real-world data sets with this eighth-grade math worksheet!
Worksheet
Constructing Scatter Plots
Worksheet
Constructing Scatter Plots
Get students creating scatter plots using real-world data sets with this eighth-grade math worksheet!
Eighth Grade
Data and Graphing
Worksheet
Mean Absolute Deviation
Worksheet
Mean Absolute Deviation
Sixth Grade
Data and Graphing
Students calculate the mean absolute deviation of data sets in this sixth-grade date and graphing worksheet.
Worksheet
Mean Absolute Deviation
Worksheet
Mean Absolute Deviation
Students calculate the mean absolute deviation of data sets in this sixth-grade date and graphing worksheet.
Sixth Grade
Data and Graphing
Worksheet
Foot Length: Create a Line Plot with Fractional Units
Worksheet
Foot Length: Create a Line Plot with Fractional Units
Fourth Grade
Data and Graphing
This worksheet challenges third graders to interpret the data and create a line plot with fractions, a key skill for fourth grade math.
Worksheet
Foot Length: Create a Line Plot with Fractional Units
Worksheet
Foot Length: Create a Line Plot with Fractional Units
This worksheet challenges third graders to interpret the data and create a line plot with fractions, a key skill for fourth grade math.
Fourth Grade
Data and Graphing
Worksheet
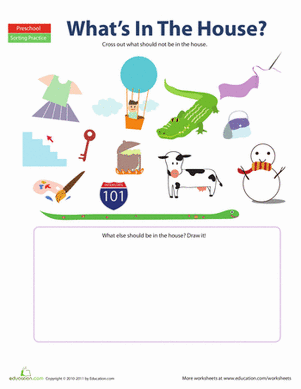
In the House: What Doesn't Belong?
Worksheet
In the House: What Doesn't Belong?
Pre-K
Data and Graphing
Does a crocodile or hot air balloon belong in the house? Challenge your little one to think logically to figure out what doesn't belong inside a house.
Worksheet
In the House: What Doesn't Belong?
Worksheet
In the House: What Doesn't Belong?
Does a crocodile or hot air balloon belong in the house? Challenge your little one to think logically to figure out what doesn't belong inside a house.
Pre-K
Data and Graphing
Worksheet
Sample Spaces of Compound Events
Worksheet
Sample Spaces of Compound Events
Seventh Grade
Data and Graphing
This seventh-grade math worksheet guides students through the process of finding the sample space of compound events.
Worksheet
Sample Spaces of Compound Events
Worksheet
Sample Spaces of Compound Events
This seventh-grade math worksheet guides students through the process of finding the sample space of compound events.
Seventh Grade
Data and Graphing
Worksheet
Interpreting Two-Way Frequency Tables
Worksheet
Interpreting Two-Way Frequency Tables
Eighth Grade
Data and Graphing
Students analyze two-way frequency tables in the context of relatable scenarios in this eighth-grade math worksheet!
Worksheet
Interpreting Two-Way Frequency Tables
Worksheet
Interpreting Two-Way Frequency Tables
Students analyze two-way frequency tables in the context of relatable scenarios in this eighth-grade math worksheet!
Eighth Grade
Data and Graphing
Worksheet
Let's Draw: Create Line Plots
Worksheet
Let's Draw: Create Line Plots
Sixth Grade
Data and Graphing
Use data from a farmers' market to create your own line plots in this sixth-grade worksheet!
Worksheet
Let's Draw: Create Line Plots
Worksheet
Let's Draw: Create Line Plots
Use data from a farmers' market to create your own line plots in this sixth-grade worksheet!
Sixth Grade
Data and Graphing
Worksheet
Translations on the Coordinate Plane
Worksheet
Translations on the Coordinate Plane
Eighth Grade
Geometry
In this eighth-grade geometry worksheet, students practice graphing images of figures after completing translations on a coordinate plane.
Worksheet
Translations on the Coordinate Plane
Worksheet
Translations on the Coordinate Plane
In this eighth-grade geometry worksheet, students practice graphing images of figures after completing translations on a coordinate plane.
Eighth Grade
Geometry
Worksheet
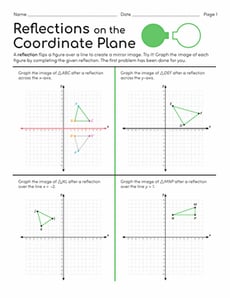
Reflections on the Coordinate Plane
Worksheet
Reflections on the Coordinate Plane
Eighth Grade
Geometry
This eighth-grade geometry worksheet gives students practice graphing images of figures after completing given reflections on coordinate planes.
Worksheet
Reflections on the Coordinate Plane
Worksheet
Reflections on the Coordinate Plane
This eighth-grade geometry worksheet gives students practice graphing images of figures after completing given reflections on coordinate planes.
Eighth Grade
Geometry
Worksheet
Practice Finding Range
Worksheet
Practice Finding Range
Sixth Grade
Data and Graphing
Give your students practice finding the range of a data set with this sixth-grade data and graphing worksheet!
Worksheet
Practice Finding Range
Worksheet
Practice Finding Range
Give your students practice finding the range of a data set with this sixth-grade data and graphing worksheet!
Sixth Grade
Data and Graphing
Worksheet
Constructing Two-Way Relative Frequency Tables
Interactive Worksheet
Constructing Two-Way Relative Frequency Tables
Eighth Grade
Data and Graphing
Practice creating two-way relative frequency tables based on real-world scenarios with this eighth-grade math worksheet!
Interactive Worksheet
Constructing Two-Way Relative Frequency Tables
Interactive Worksheet
Constructing Two-Way Relative Frequency Tables
Practice creating two-way relative frequency tables based on real-world scenarios with this eighth-grade math worksheet!
Eighth Grade
Data and Graphing
Interactive Worksheet
Scatter Plots
Worksheet
Scatter Plots
Eighth Grade
Data and Graphing
Students practice identifying outliers and the types of associations shown on scatter plots in this eighth-grade data and graphing worksheet!
Worksheet
Scatter Plots
Worksheet
Scatter Plots
Students practice identifying outliers and the types of associations shown on scatter plots in this eighth-grade data and graphing worksheet!
Eighth Grade
Data and Graphing
Worksheet
Reading Pictographs: Going to the Theater
Worksheet
Reading Pictographs: Going to the Theater
Third Grade
Data and Graphing
In this 3rd grade math worksheet, kids practice interpreting graph data as they use the information in a pictograph to answer a set of questions.
Worksheet
Reading Pictographs: Going to the Theater
Worksheet
Reading Pictographs: Going to the Theater
In this 3rd grade math worksheet, kids practice interpreting graph data as they use the information in a pictograph to answer a set of questions.
Third Grade
Data and Graphing
Worksheet
Make Predictions Using Theoretical Probability
Interactive Worksheet
Make Predictions Using Theoretical Probability
Seventh Grade
Data and Graphing
In this seventh-grade probability worksheet, students will practice finding the theoretical probabilities for different events and using those to make predictions.
Interactive Worksheet
Make Predictions Using Theoretical Probability
Interactive Worksheet
Make Predictions Using Theoretical Probability
In this seventh-grade probability worksheet, students will practice finding the theoretical probabilities for different events and using those to make predictions.
Seventh Grade
Data and Graphing
Interactive Worksheet
Bar Graph: Getting to School
Worksheet
Bar Graph: Getting to School
Third Grade
Data and Graphing
Kids completing this third grade math worksheet use a bar graph to compare data about transportation to school and solve addition and subtraction problems.
Worksheet
Bar Graph: Getting to School
Worksheet
Bar Graph: Getting to School
Kids completing this third grade math worksheet use a bar graph to compare data about transportation to school and solve addition and subtraction problems.
Third Grade
Data and Graphing
Worksheet
Histograms
Worksheet
Histograms
Sixth Grade
Data and Graphing
In this sixth-grade data and graphing worksheet, students will complete histograms from given data sets and frequency tables.
Worksheet
Histograms
Worksheet
Histograms
In this sixth-grade data and graphing worksheet, students will complete histograms from given data sets and frequency tables.
Sixth Grade
Data and Graphing
Worksheet
Experimental Probability
Worksheet
Experimental Probability
Seventh Grade
Data and Graphing
This seventh-grade math worksheet gives students a chance to find experimental probabilities using real-world scenarios in the form of word problems!
Worksheet
Experimental Probability
Worksheet
Experimental Probability
This seventh-grade math worksheet gives students a chance to find experimental probabilities using real-world scenarios in the form of word problems!
Seventh Grade
Data and Graphing
Worksheet
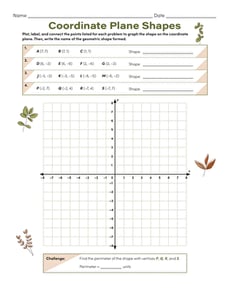
Coordinate Plane Shapes
Worksheet
Coordinate Plane Shapes
Sixth Grade
Data and Graphing
Give your students practice drawing polygons on the coordinate plane using given coordinates for the vertices with this sixth-grade geometry worksheet!
Worksheet
Coordinate Plane Shapes
Worksheet
Coordinate Plane Shapes
Give your students practice drawing polygons on the coordinate plane using given coordinates for the vertices with this sixth-grade geometry worksheet!
Sixth Grade
Data and Graphing
Worksheet
Make Predictions Using Experimental Probability
Interactive Worksheet
Make Predictions Using Experimental Probability
Seventh Grade
Data and Graphing
In this seventh-grade probability worksheet, students are introduced to the concept of experimental probability and shown how to use this information to make predictions.
Interactive Worksheet
Make Predictions Using Experimental Probability
Interactive Worksheet
Make Predictions Using Experimental Probability
In this seventh-grade probability worksheet, students are introduced to the concept of experimental probability and shown how to use this information to make predictions.
Seventh Grade
Data and Graphing
Interactive Worksheet
Go Runners! Practice Reading a Bar Graph
Worksheet
Go Runners! Practice Reading a Bar Graph
Third Grade
Data and Graphing
Your child will practice reading and interpreting a bar graph and using its data to answer a set of questions in this 3rd grade math worksheet.
Worksheet
Go Runners! Practice Reading a Bar Graph
Worksheet
Go Runners! Practice Reading a Bar Graph
Your child will practice reading and interpreting a bar graph and using its data to answer a set of questions in this 3rd grade math worksheet.
Third Grade
Data and Graphing
Worksheet
1
2
3
4
5
6