SKIP TO CONTENT
Worksheet Generator
Subjects
Grades
Worksheets
Games
Build a Worksheet
More Resources
Roly Recommends
Math Month
Subjects
Grades
Worksheets
Games
Build a Worksheet
More Resources
Roly Recommends
Math Month
All Subjects
Math
Subtopics:
Addition
Subtraction
Multiplication
Division
Numbers and Counting
Patterns
Place Value
Mixed Operations
Fractions
Decimals
Integers and Rational Numbers
Exponents and Roots
Number Theory
Time and Money
Ratios and Proportions
Algebra
Geometry
Measurement
Data and Graphing
Probability
Statistics
Math Puzzles
Show Less
Filters
Search for: and, data, 4
✕
Math
✕
Subjects
Math
English Language Arts
Science
Social Studies
Foreign Language
Grade Level
Pre-K
K
1st
2nd
3rd
4th
5th
6th
7th
8th
Early Childhood
Elementary School
Middle School
Resource Type
Worksheets
Games
Lesson Plans
Interactive Worksheets
Workbooks
Activities
Exercises
Stories
Songs
Offline Games
Guided Lessons
Teacher Resources
See more
Occasion
Birthdays
St. Patrick's Day
Spring
Easter
Mother's Day
Summer
Father's Day
Independence Day
Back to School
Fall
Halloween
Winter
Holidays
Thanksgiving
Christmas
New Year
Lunar New Year
Valentine's Day
See more
Common Core
Yes
No
Roly Recommends
Social Emotional Learning
Game Type
Mazes
Dot to Dot
Ball Games
Fitness & Exercise
Group Games
Outdoor Games
Printable Board Games
Puzzles & Sudoku
Word Search
See more
Arts & Crafts
Arts & Crafts
Fabric Projects
Paper & Glue Crafts
Construction & Sculpture
Painting & Drawing
Recycled Crafts
Coloring
Yes
Recipes
Snacks
Mains
Sides
English Language Support
Yes
See More
Clear All
View 1,560 results
Showing Results for and data 4 : Page 19
1,560 results
Search for: and, data, 4
✕
Math
✕
Sort by:
Relevance
Most recent
Most popular
Alphabetical A-Z
Alphabetical Z-A
All filters
1,560 results
Sort by:
Relevance
Most recent
Most popular
Alphabetical A-Z
Alphabetical Z-A
Box Plots #3
Interactive Worksheet
Box Plots #3
Sixth Grade
Data and Graphing
Become an expert at interpreting box plots with this sixth-grade worksheet!
Interactive Worksheet
Box Plots #3
Interactive Worksheet
Box Plots #3
Become an expert at interpreting box plots with this sixth-grade worksheet!
Sixth Grade
Data and Graphing
Interactive Worksheet
Practice Reading Venn Diagrams #3: Favorite Dessert
Worksheet
Practice Reading Venn Diagrams #3: Favorite Dessert
Second Grade
Data and Graphing
Kids practice reading a Venn diagram about favorite desserts and answer questions about it in this 2nd grade math worksheet.
Worksheet
Practice Reading Venn Diagrams #3: Favorite Dessert
Worksheet
Practice Reading Venn Diagrams #3: Favorite Dessert
Kids practice reading a Venn diagram about favorite desserts and answer questions about it in this 2nd grade math worksheet.
Second Grade
Data and Graphing
Worksheet
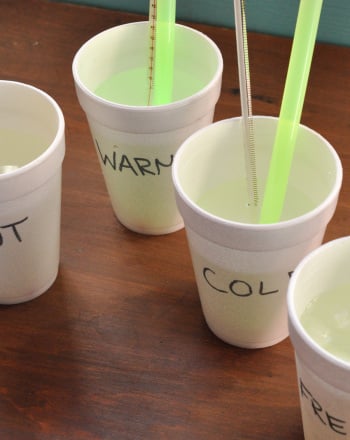
How to Keep Your Light Sticks Lit Up Longer
Activity
How to Keep Your Light Sticks Lit Up Longer
Measurement
Examine the connection between temperature and chemiluminescence.
Activity
How to Keep Your Light Sticks Lit Up Longer
Activity
How to Keep Your Light Sticks Lit Up Longer
Examine the connection between temperature and chemiluminescence.
Measurement
Activity
Making Comparative Inferences
Worksheet
Making Comparative Inferences
Seventh Grade
Data and Graphing
Give students practice creating box plots and making comparative inferences with this seventh-grade math worksheet!
Worksheet
Making Comparative Inferences
Worksheet
Making Comparative Inferences
Give students practice creating box plots and making comparative inferences with this seventh-grade math worksheet!
Seventh Grade
Data and Graphing
Worksheet
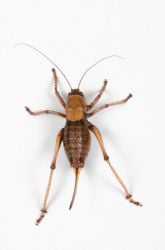
Accuracy Deviation of the Cricket Thermometer
Activity
Accuracy Deviation of the Cricket Thermometer
Measurement
This science fair project idea quantifies exactly how accurate the cricket thermometer is.
Activity
Accuracy Deviation of the Cricket Thermometer
Activity
Accuracy Deviation of the Cricket Thermometer
This science fair project idea quantifies exactly how accurate the cricket thermometer is.
Measurement
Activity
Practice Reading Venn Diagrams #2: In the Orchestra
Worksheet
Practice Reading Venn Diagrams #2: In the Orchestra
Second Grade
Data and Graphing
Kids practice reading a Venn diagram about instruments in an orchestra and answering questions about it in this 2nd grade math worksheet.
Worksheet
Practice Reading Venn Diagrams #2: In the Orchestra
Worksheet
Practice Reading Venn Diagrams #2: In the Orchestra
Kids practice reading a Venn diagram about instruments in an orchestra and answering questions about it in this 2nd grade math worksheet.
Second Grade
Data and Graphing
Worksheet
Picture Graphing with Fish
Game
Picture Graphing with Fish
Third Grade
Data and Graphing
Fish, fish everywhere! Kids catch fish to sort and graph in this zany game.
Game
Picture Graphing with Fish
Game
Picture Graphing with Fish
Fish, fish everywhere! Kids catch fish to sort and graph in this zany game.
Third Grade
Data and Graphing
Game
Can You Hear Me Now?
Activity
Can You Hear Me Now?
Measurement
The goal of this science fair project is to evaluate the effect of heat on sound wave frequency.
Activity
Can You Hear Me Now?
Activity
Can You Hear Me Now?
The goal of this science fair project is to evaluate the effect of heat on sound wave frequency.
Measurement
Activity
Constructing Two-Way Relative Frequency Tables
Interactive Worksheet
Constructing Two-Way Relative Frequency Tables
Eighth Grade
Data and Graphing
Practice creating two-way relative frequency tables based on real-world scenarios with this eighth-grade math worksheet!
Interactive Worksheet
Constructing Two-Way Relative Frequency Tables
Interactive Worksheet
Constructing Two-Way Relative Frequency Tables
Practice creating two-way relative frequency tables based on real-world scenarios with this eighth-grade math worksheet!
Eighth Grade
Data and Graphing
Interactive Worksheet
Find Mean, Median, and Mode
Interactive Worksheet
Find Mean, Median, and Mode
Sixth Grade
Statistics
Sharpen your statistics skills with this sixth-grade worksheet!
Interactive Worksheet
Find Mean, Median, and Mode
Interactive Worksheet
Find Mean, Median, and Mode
Sharpen your statistics skills with this sixth-grade worksheet!
Sixth Grade
Statistics
Interactive Worksheet
Graph My Design
Worksheet
Graph My Design
First Grade
Data and Graphing
Students build a design and then use this bar graph to show how many of each shape was used. Place inside a sheet protector to reuse.
Worksheet
Graph My Design
Worksheet
Graph My Design
Students build a design and then use this bar graph to show how many of each shape was used. Place inside a sheet protector to reuse.
First Grade
Data and Graphing
Worksheet
Ice Cream Graph #19
Worksheet
Ice Cream Graph #19
First Grade
Data and Graphing
Ice cream for sale! Sam, Kate, and Becky need help keeping track of how many ice cream cones they've sold. Your child will complete a pictograph to help them.
Worksheet
Ice Cream Graph #19
Worksheet
Ice Cream Graph #19
Ice cream for sale! Sam, Kate, and Becky need help keeping track of how many ice cream cones they've sold. Your child will complete a pictograph to help them.
First Grade
Data and Graphing
Worksheet
Describing Distributions in Dot Plots
Worksheet
Describing Distributions in Dot Plots
Sixth Grade
Data and Graphing
Students explore distributions in dot plots with this sixth-grade statistics worksheet!
Worksheet
Describing Distributions in Dot Plots
Worksheet
Describing Distributions in Dot Plots
Students explore distributions in dot plots with this sixth-grade statistics worksheet!
Sixth Grade
Data and Graphing
Worksheet
Ice Cream Bar Graph #9
Worksheet
Ice Cream Bar Graph #9
First Grade
Data and Graphing
Sam, Kate, and Becky have just had a long day of selling ice cream cones, and they want to know how many were sold. Help them with this pictograph worksheet.
Worksheet
Ice Cream Bar Graph #9
Worksheet
Ice Cream Bar Graph #9
Sam, Kate, and Becky have just had a long day of selling ice cream cones, and they want to know how many were sold. Help them with this pictograph worksheet.
First Grade
Data and Graphing
Worksheet
Make a Venn Diagram: Gift Boxes
Worksheet
Make a Venn Diagram: Gift Boxes
Second Grade
Data and Graphing
Kids practice making a Venn diagram about kinds of gift wrap by sorting the gifts in their correct spaces in this 2nd grade math worksheet.
Worksheet
Make a Venn Diagram: Gift Boxes
Worksheet
Make a Venn Diagram: Gift Boxes
Kids practice making a Venn diagram about kinds of gift wrap by sorting the gifts in their correct spaces in this 2nd grade math worksheet.
Second Grade
Data and Graphing
Worksheet
Microclimates
Activity
Microclimates
Measurement
Explore this fun science fair project idea to investigate different microclimates in and around your home and their effects on the plant and animal life.
Activity
Microclimates
Activity
Microclimates
Explore this fun science fair project idea to investigate different microclimates in and around your home and their effects on the plant and animal life.
Measurement
Activity
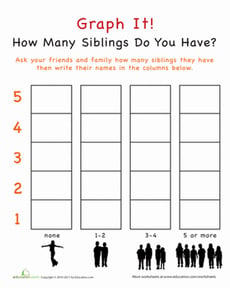
Graph It! How Many Siblings Do You Have?
Worksheet
Graph It! How Many Siblings Do You Have?
Kindergarten
Data and Graphing
Use this Graph It! worksheet to show your child the practical side of math. This graphing exercise gets your child to survey his friends on their siblings.
Worksheet
Graph It! How Many Siblings Do You Have?
Worksheet
Graph It! How Many Siblings Do You Have?
Use this Graph It! worksheet to show your child the practical side of math. This graphing exercise gets your child to survey his friends on their siblings.
Kindergarten
Data and Graphing
Worksheet
Graph Practice
Interactive Worksheet
Graph Practice
Second Grade
Data and Graphing
Don't let your second grader forget graphs! Be sure to review how to read a bar graph and pictograph with help from this handy worksheet. Challenge your young mathematician to read the graphs and answer some questions.
Interactive Worksheet
Graph Practice
Interactive Worksheet
Graph Practice
Don't let your second grader forget graphs! Be sure to review how to read a bar graph and pictograph with help from this handy worksheet. Challenge your young mathematician to read the graphs and answer some questions.
Second Grade
Data and Graphing
Interactive Worksheet
Interpreting Line Plots with Fractional Units
Worksheet
Interpreting Line Plots with Fractional Units
Third Grade
Data and Graphing
In this third grade worksheet, kids will interpret a line plot that includes fractional units.
Worksheet
Interpreting Line Plots with Fractional Units
Worksheet
Interpreting Line Plots with Fractional Units
In this third grade worksheet, kids will interpret a line plot that includes fractional units.
Third Grade
Data and Graphing
Worksheet
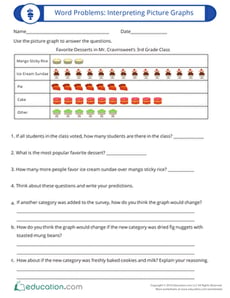
Word Problems: Interpreting Picture Graphs
Worksheet
Word Problems: Interpreting Picture Graphs
Third Grade
Data and Graphing
Students will cultivate the skills of reading, interpreting and analyzing picture graphs with this word problem that activates higher order thinking.
Worksheet
Word Problems: Interpreting Picture Graphs
Worksheet
Word Problems: Interpreting Picture Graphs
Students will cultivate the skills of reading, interpreting and analyzing picture graphs with this word problem that activates higher order thinking.
Third Grade
Data and Graphing
Worksheet
Developing a New, Improved Cold Pack
Activity
Developing a New, Improved Cold Pack
Measurement
The purpose of this science project is to determine which chemical best lowers the temperature of water in a cold pack and if the amount affects its use.
Activity
Developing a New, Improved Cold Pack
Activity
Developing a New, Improved Cold Pack
The purpose of this science project is to determine which chemical best lowers the temperature of water in a cold pack and if the amount affects its use.
Measurement
Activity
Winter Sports: Practice Reading a Bar Graph
Worksheet
Winter Sports: Practice Reading a Bar Graph
Second Grade
Data and Graphing
Children will practice interpreting a bar graph in this winter sports–themed math worksheet.
Worksheet
Winter Sports: Practice Reading a Bar Graph
Worksheet
Winter Sports: Practice Reading a Bar Graph
Children will practice interpreting a bar graph in this winter sports–themed math worksheet.
Second Grade
Data and Graphing
Worksheet
Word Problems: Interpreting Line Plots
Worksheet
Word Problems: Interpreting Line Plots
Second Grade
Data and Graphing
Students will have a chance to practice solving word problems using line plots with this worksheet.
Worksheet
Word Problems: Interpreting Line Plots
Worksheet
Word Problems: Interpreting Line Plots
Students will have a chance to practice solving word problems using line plots with this worksheet.
Second Grade
Data and Graphing
Worksheet
Feline Delights: Scatter Plots Performance Task
Worksheet
Feline Delights: Scatter Plots Performance Task
Eighth Grade
Algebra
Students apply their knowledge of statistics and probability in a real-world context in this two-page performance task!
Worksheet
Feline Delights: Scatter Plots Performance Task
Worksheet
Feline Delights: Scatter Plots Performance Task
Students apply their knowledge of statistics and probability in a real-world context in this two-page performance task!
Eighth Grade
Algebra
Worksheet
Interpreting Double Bar Graphs
Worksheet
Interpreting Double Bar Graphs
Fifth Grade
Data and Graphing
Students will cultivate the skills of reading, interpreting, and analyzing bar graphs with these questions that activate higher order thinking.
Worksheet
Interpreting Double Bar Graphs
Worksheet
Interpreting Double Bar Graphs
Students will cultivate the skills of reading, interpreting, and analyzing bar graphs with these questions that activate higher order thinking.
Fifth Grade
Data and Graphing
Worksheet
Which Metal Should a Pan Be Made Of?
Activity
Which Metal Should a Pan Be Made Of?
Measurement
Determine which metal has the highest rate of conductivity.
Activity
Which Metal Should a Pan Be Made Of?
Activity
Which Metal Should a Pan Be Made Of?
Determine which metal has the highest rate of conductivity.
Measurement
Activity
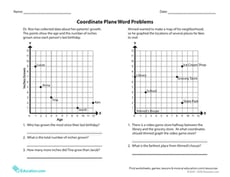
Coordinate Plane Word Problems
Worksheet
Coordinate Plane Word Problems
Fifth Grade
Geometry
Challenge your students to read and interpret information in the first quadrant.
Worksheet
Coordinate Plane Word Problems
Worksheet
Coordinate Plane Word Problems
Challenge your students to read and interpret information in the first quadrant.
Fifth Grade
Geometry
Worksheet
Summer Graphing
Worksheet
Summer Graphing
Kindergarten
Numbers and Counting
Shine some light on counting and graphing in this colorful summer worksheet!
Worksheet
Summer Graphing
Worksheet
Summer Graphing
Shine some light on counting and graphing in this colorful summer worksheet!
Kindergarten
Numbers and Counting
Worksheet
The Best Choice for Growing Large, Flowering Plants
Activity
The Best Choice for Growing Large, Flowering Plants
Measurement
The purpose of this science project is to investigate which will grow larger plants: compost, soil and Miracle - Gro, a mixture of both.
Activity
The Best Choice for Growing Large, Flowering Plants
Activity
The Best Choice for Growing Large, Flowering Plants
The purpose of this science project is to investigate which will grow larger plants: compost, soil and Miracle - Gro, a mixture of both.
Measurement
Activity
Olympic Math: Mean, Median and Mode Review
Lesson Plan
Olympic Math: Mean, Median and Mode Review
Fifth Grade
Data and Graphing
Help your students win gold with this lesson that gives them plenty of practice with mode, median, and mean.
Lesson Plan
Olympic Math: Mean, Median and Mode Review
Lesson Plan
Olympic Math: Mean, Median and Mode Review
Help your students win gold with this lesson that gives them plenty of practice with mode, median, and mean.
Fifth Grade
Data and Graphing
Lesson Plan
1
…
18
19
20
…
52