SKIP TO CONTENT
Worksheet Generator
Subjects
Grades
Worksheets
Games
Build a Worksheet
More Resources
Roly Recommends
Subjects
Grades
Worksheets
Games
Build a Worksheet
More Resources
Roly Recommends
All Subjects
Math
Subtopics:
Addition
Subtraction
Multiplication
Fractions
Time and Money
Algebra
Geometry
Measurement
Data and Graphing
Statistics
Show Less
Filters
Search for: haunting, plots
✕
Math
✕
Common Core
✕
Subjects
Math
English Language Arts
Grade Level
Pre-K
K
1st
2nd
3rd
4th
5th
6th
7th
8th
Early Childhood
Elementary School
Middle School
Resource Type
Worksheets
Lesson Plans
Interactive Worksheets
Exercises
Occasion
Halloween
Holidays
Common Core
Yes
English Language Support
Yes
See More
Clear All
View 48 results
Showing Results for haunting plots : Page 2
48 results
Search for: haunting, plots
✕
Math
✕
Common Core
✕
Clear All
Sort by:
Relevance
Most recent
Most popular
Alphabetical A-Z
Alphabetical Z-A
All filters
48 results
Sort by:
Relevance
Most recent
Most popular
Alphabetical A-Z
Alphabetical Z-A
Fractions and Line Plots 1
Exercise
Fractions and Line Plots 1
Third Grade
Fractions
Show students how to use a line plot to examine fractions with this easy to follow exercise.
Exercise
Fractions and Line Plots 1
Exercise
Fractions and Line Plots 1
Show students how to use a line plot to examine fractions with this easy to follow exercise.
Third Grade
Fractions
Exercise
From Dot Plots to Histograms
Worksheet
From Dot Plots to Histograms
Sixth Grade
Data and Graphing
Discover different ways to display data in this delightful sixth-grade worksheet!
Worksheet
From Dot Plots to Histograms
Worksheet
From Dot Plots to Histograms
Discover different ways to display data in this delightful sixth-grade worksheet!
Sixth Grade
Data and Graphing
Worksheet
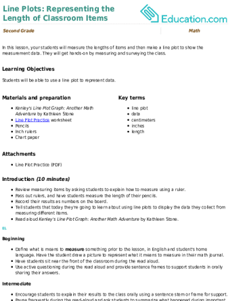
Line Plots: Representing the Length of Classroom Items
Lesson Plan
Line Plots: Representing the Length of Classroom Items
Second Grade
Measurement
In this lesson, your students will measure the lengths of items and then make a line plot to show the measurement data. They will get hands-on by measuring and surveying the class.
Lesson Plan
Line Plots: Representing the Length of Classroom Items
Lesson Plan
Line Plots: Representing the Length of Classroom Items
In this lesson, your students will measure the lengths of items and then make a line plot to show the measurement data. They will get hands-on by measuring and surveying the class.
Second Grade
Measurement
Lesson Plan
Write Problem Questions for Line Plots
Worksheet
Write Problem Questions for Line Plots
Third Grade
Data and Graphing
Give your students the opportunity to think critically as a mathematician. In this exercise, they will analyze a line plot and create questions about the data.
Worksheet
Write Problem Questions for Line Plots
Worksheet
Write Problem Questions for Line Plots
Give your students the opportunity to think critically as a mathematician. In this exercise, they will analyze a line plot and create questions about the data.
Third Grade
Data and Graphing
Worksheet
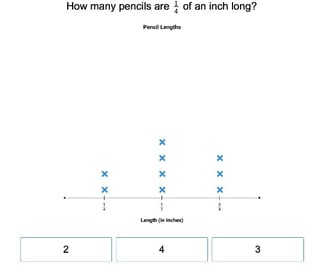
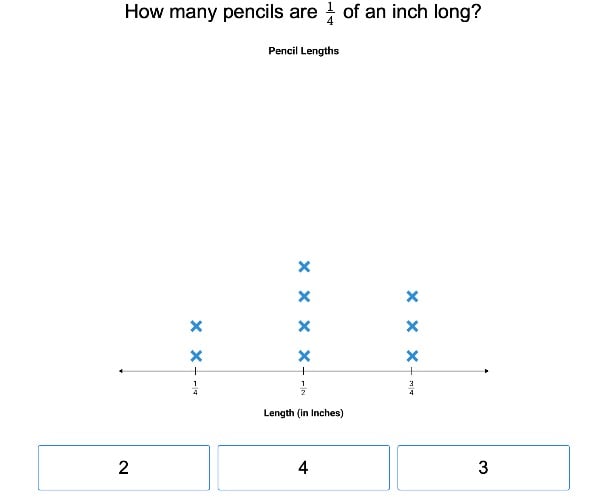
Interpreting Line Plots with Fractional Units
Worksheet
Interpreting Line Plots with Fractional Units
Third Grade
Data and Graphing
In this third grade worksheet, kids will interpret a line plot that includes fractional units.
Worksheet
Interpreting Line Plots with Fractional Units
Worksheet
Interpreting Line Plots with Fractional Units
In this third grade worksheet, kids will interpret a line plot that includes fractional units.
Third Grade
Data and Graphing
Worksheet
Drawing Inferences Using Data
Worksheet
Drawing Inferences Using Data
Seventh Grade
Data and Graphing
Students compare different survey methods to make inferences about how much time students at a school spend playing video games in this seventh-grade math worksheet.
Worksheet
Drawing Inferences Using Data
Worksheet
Drawing Inferences Using Data
Students compare different survey methods to make inferences about how much time students at a school spend playing video games in this seventh-grade math worksheet.
Seventh Grade
Data and Graphing
Worksheet
How Do You Measure Up?
Worksheet
How Do You Measure Up?
Fifth Grade
Fractions
Students will take practice measurements of real world objects and make a line plot of the data.
Worksheet
How Do You Measure Up?
Worksheet
How Do You Measure Up?
Students will take practice measurements of real world objects and make a line plot of the data.
Fifth Grade
Fractions
Worksheet
Measurement & Data Review
Worksheet
Measurement & Data Review
Fifth Grade
Fractions
Assess your students’ knowledge of fifth grade data and measurement concepts.
Worksheet
Measurement & Data Review
Worksheet
Measurement & Data Review
Assess your students’ knowledge of fifth grade data and measurement concepts.
Fifth Grade
Fractions
Worksheet
Create a Line Plot (With Your Own Data!)
Worksheet
Create a Line Plot (With Your Own Data!)
Second Grade
Data and Graphing
Invite students to become researchers with this open-ended line plot template!
Worksheet
Create a Line Plot (With Your Own Data!)
Worksheet
Create a Line Plot (With Your Own Data!)
Invite students to become researchers with this open-ended line plot template!
Second Grade
Data and Graphing
Worksheet
Halloween Word Problems #8
Worksheet
Halloween Word Problems #8
Second Grade
Addition
Don't get spooked out by math! These Halloween word problems bring some scary fun to your math exercises.
Worksheet
Halloween Word Problems #8
Worksheet
Halloween Word Problems #8
Don't get spooked out by math! These Halloween word problems bring some scary fun to your math exercises.
Second Grade
Addition
Worksheet
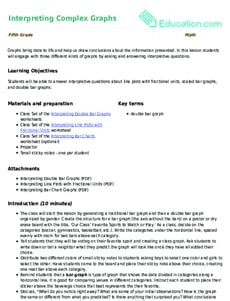
Interpreting Complex Graphs
Lesson Plan
Interpreting Complex Graphs
Fifth Grade
Math
Graphs bring data to life and help us draw conclusions about the information presented. In this lesson students will engage with three different kinds of graphs by asking and answering interpretive questions.
Lesson Plan
Interpreting Complex Graphs
Lesson Plan
Interpreting Complex Graphs
Graphs bring data to life and help us draw conclusions about the information presented. In this lesson students will engage with three different kinds of graphs by asking and answering interpretive questions.
Fifth Grade
Math
Lesson Plan
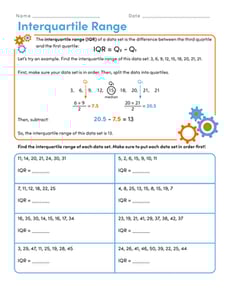
Interquartile Range
Interactive Worksheet
Interquartile Range
Sixth Grade
Statistics
In this sixth-grade statistics worksheet, students will practice finding the interquartile range of data sets.
Interactive Worksheet
Interquartile Range
Interactive Worksheet
Interquartile Range
In this sixth-grade statistics worksheet, students will practice finding the interquartile range of data sets.
Sixth Grade
Statistics
Interactive Worksheet
Box and Whisker Plot
Worksheet
Box and Whisker Plot
Sixth Grade
Data and Graphing
Students learn how to find the five-number summary and create a box and whisker plot for given data sets.
Worksheet
Box and Whisker Plot
Worksheet
Box and Whisker Plot
Students learn how to find the five-number summary and create a box and whisker plot for given data sets.
Sixth Grade
Data and Graphing
Worksheet
Create Histograms From Data Sets
Worksheet
Create Histograms From Data Sets
Sixth Grade
Data and Graphing
Draw data to show a scientist’s findings in this practical worksheet!
Worksheet
Create Histograms From Data Sets
Worksheet
Create Histograms From Data Sets
Draw data to show a scientist’s findings in this practical worksheet!
Sixth Grade
Data and Graphing
Worksheet
Find Mean, Median, and Mode
Interactive Worksheet
Find Mean, Median, and Mode
Sixth Grade
Statistics
Sharpen your statistics skills with this sixth-grade worksheet!
Interactive Worksheet
Find Mean, Median, and Mode
Interactive Worksheet
Find Mean, Median, and Mode
Sharpen your statistics skills with this sixth-grade worksheet!
Sixth Grade
Statistics
Interactive Worksheet
Interpreting Slopes and y-Intercepts of Lines of Best Fit
Worksheet
Interpreting Slopes and y-Intercepts of Lines of Best Fit
Eighth Grade
Algebra
Students interpret slopes and
y
-intercepts of lines of best fit based on real-world scenarios in this eighth-grade worksheet!
Worksheet
Interpreting Slopes and y-Intercepts of Lines of Best Fit
Worksheet
Interpreting Slopes and y-Intercepts of Lines of Best Fit
Students interpret slopes and
y
-intercepts of lines of best fit based on real-world scenarios in this eighth-grade worksheet!
Eighth Grade
Algebra
Worksheet
Let's Play Ball
Lesson Plan
Let's Play Ball
Third Grade
Multiplication
Students will have a ball with this data collection lesson plan where they learn about collecting and plotting data on a chart and line plot.
Lesson Plan
Let's Play Ball
Lesson Plan
Let's Play Ball
Students will have a ball with this data collection lesson plan where they learn about collecting and plotting data on a chart and line plot.
Third Grade
Multiplication
Lesson Plan
Bar Graphs: Interpreting Data
Lesson Plan
Bar Graphs: Interpreting Data
Second Grade
Data and Graphing
In this lesson, students will make bar graphs and interpret data using real-life data from other students. They will get practice writing and answering survey questions.
Lesson Plan
Bar Graphs: Interpreting Data
Lesson Plan
Bar Graphs: Interpreting Data
In this lesson, students will make bar graphs and interpret data using real-life data from other students. They will get practice writing and answering survey questions.
Second Grade
Data and Graphing
Lesson Plan
1
2