SKIP TO CONTENT
Worksheet Generator
Subjects
Grades
Worksheets
Games
Build a Worksheet
More Resources
Roly Recommends
Subjects
Grades
Worksheets
Games
Build a Worksheet
More Resources
Roly Recommends
3rd - 5th Grade Line Plots Resources for 'other 1'
Filters
Math
Data and Graphing
3 results
Search for: other, 1
✕
Math
✕
3rd and 5th Grade
✕
Clear all
3 results
Subtopics:
Collecting and Organizing Data
Picture Graphs
Bar Graphs
Line Plots
✕
Coordinate Plane
Show Less
Filters
Search for: other, 1
✕
Math
✕
3rd and 5th Grade
✕
Subjects
Math
English Language Arts
Science
Social Studies
Foreign Language
Technology
Grade Level
Pre-K
K
1st
2nd
3rd
4th
5th
6th
7th
8th
Early Childhood
Elementary School
Middle School
Resource Type
Worksheets
Exercises
Guided Lessons
Common Core
Yes
Clear all
View 3 results
3rd - 5th Grade Line Plots Resources for 'other 1'
Filters
3 results
Search for: other, 1
✕
Math
✕
3rd and 5th Grade
✕
Clear all
3 results
Measurement and Graphing 1
Exercise
Measurement and Graphing 1
Third Grade
Fractions
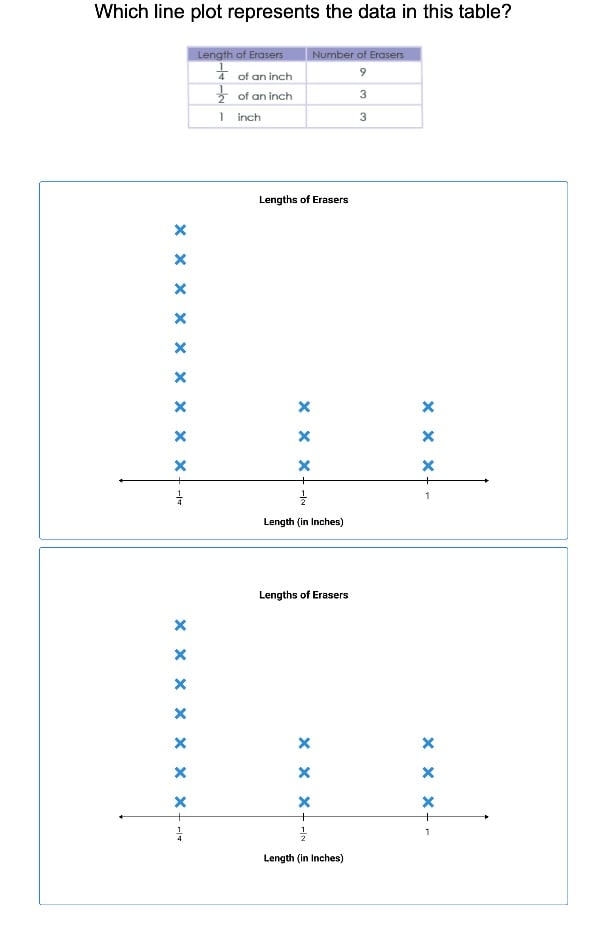
This exercise will introduce students to the concept of taking measurements and graphing the data.
Exercise
Measurement and Graphing 1
Exercise
Measurement and Graphing 1
This exercise will introduce students to the concept of taking measurements and graphing the data.
Third Grade
Fractions
Exercise
Data 2
Guided Lesson
Data 2
Fifth Grade
Fractions
Understanding data and graphs is a critical skill that we use on a regular basis to read news articles, reports and other media to interpret information. In this unit, students investigate data collection, data organization and visual representation in different kinds of graphics (i.e. line plots, pie charts). Learners also apply concepts of probability and statistics to analyze data.
Guided Lesson
Data 2
Guided Lesson
Data 2
Understanding data and graphs is a critical skill that we use on a regular basis to read news articles, reports and other media to interpret information. In this unit, students investigate data collection, data organization and visual representation in different kinds of graphics (i.e. line plots, pie charts). Learners also apply concepts of probability and statistics to analyze data.
Fifth Grade
Fractions
Guided Lesson
How Do You Measure Up?
Worksheet
How Do You Measure Up?
Fifth Grade
Fractions
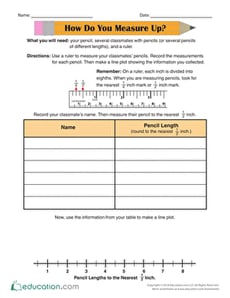
Students will take practice measurements of real world objects and make a line plot of the data.
Worksheet
How Do You Measure Up?
Worksheet
How Do You Measure Up?
Students will take practice measurements of real world objects and make a line plot of the data.
Fifth Grade
Fractions
Worksheet
1