SKIP TO CONTENT
Worksheet Generator
Subjects
Grades
Worksheets
Games
Build a Worksheet
More Resources
Roly Recommends
Subjects
Grades
Worksheets
Games
Build a Worksheet
More Resources
Roly Recommends
All Subjects
Math
Data and Graphing
Subtopics:
Collecting and Organizing Data
Picture Graphs
Bar Graphs
Line Plots
Show Less
Filters
Search for: and, data, 4
✕
Math
✕
Kindergarten - 4th Grade
✕
Subjects
Math
English Language Arts
Science
Social Studies
Foreign Language
Grade Level
Pre-K
K
1st
2nd
3rd
4th
5th
6th
7th
8th
Early Childhood
Elementary School
Middle School
Resource Type
Worksheets
Games
Lesson Plans
Interactive Worksheets
Workbooks
Activities
Exercises
Offline Games
Guided Lessons
Teacher Resources
Occasion
Birthdays
Summer
Back to School
Halloween
Winter
Holidays
Lunar New Year
Valentine's Day
Common Core
Yes
Game Type
Ball Games
English Language Support
Yes
See More
Clear All
View 199 results
Showing Results for and data 4 : Page 4
199 results
Search for: and, data, 4
✕
Math
✕
Kindergarten - 4th Grade
✕
Clear All
Sort by:
Relevance
Most recent
Most popular
Alphabetical A-Z
Alphabetical Z-A
All filters
199 results
Sort by:
Relevance
Most recent
Most popular
Alphabetical A-Z
Alphabetical Z-A
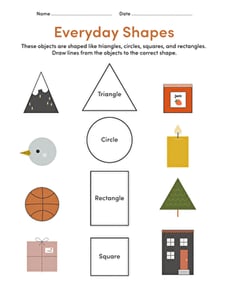
Preschool Math: Everyday Shapes #4
Worksheet
Preschool Math: Everyday Shapes #4
Kindergarten
Geometry
Children will enjoy matching familiar foods and objects to their corresponding shapes in this appealing worksheet.
Worksheet
Preschool Math: Everyday Shapes #4
Worksheet
Preschool Math: Everyday Shapes #4
Children will enjoy matching familiar foods and objects to their corresponding shapes in this appealing worksheet.
Kindergarten
Geometry
Worksheet
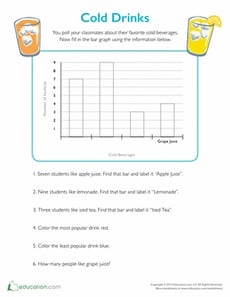
Cold Drinks Bar Graph
Worksheet
Cold Drinks Bar Graph
Second Grade
Data and Graphing
Use an easy bar graph to find out what your classmates' favorite cold drinks are. Kids will get the chance to analyze data and color in the bar graph.
Worksheet
Cold Drinks Bar Graph
Worksheet
Cold Drinks Bar Graph
Use an easy bar graph to find out what your classmates' favorite cold drinks are. Kids will get the chance to analyze data and color in the bar graph.
Second Grade
Data and Graphing
Worksheet
What is it Telling Me? Creating and Interpreting Line Plots
Lesson Plan
What is it Telling Me? Creating and Interpreting Line Plots
Third Grade
Data and Graphing
Line plots are a great way to introduce your students to graphing data. In this lesson, your students will learn how to create a line plot and also practice interpreting line plots.
Lesson Plan
What is it Telling Me? Creating and Interpreting Line Plots
Lesson Plan
What is it Telling Me? Creating and Interpreting Line Plots
Line plots are a great way to introduce your students to graphing data. In this lesson, your students will learn how to create a line plot and also practice interpreting line plots.
Third Grade
Data and Graphing
Lesson Plan
Practice Graphs
Worksheet
Practice Graphs
Second Grade
Data and Graphing
Kids practice representing a set of data using three kinds of graphs: a bar graph, pictograph, and pie graph.
Worksheet
Practice Graphs
Worksheet
Practice Graphs
Kids practice representing a set of data using three kinds of graphs: a bar graph, pictograph, and pie graph.
Second Grade
Data and Graphing
Worksheet
EL
Graph My Design
Lesson Plan
Graph My Design
First Grade
Geometry
Geometry meets data in this fun lesson! Students will build a design using pattern blocks and then graph the number of each shape used. This scaffolded EL lesson can be used alone or alongside
Graphing Colored Counters.
Lesson Plan
EL
Graph My Design
Lesson Plan
Graph My Design
Geometry meets data in this fun lesson! Students will build a design using pattern blocks and then graph the number of each shape used. This scaffolded EL lesson can be used alone or alongside
Graphing Colored Counters.
First Grade
Geometry
Lesson Plan
Reading Pictographs: Drink Your Milk!
Worksheet
Reading Pictographs: Drink Your Milk!
Third Grade
Data and Graphing
Can your child help Tommy figure out how much milk he drinks? As she does, she'll learn how to read and interpret data in graphs and practice multiplication.
Worksheet
Reading Pictographs: Drink Your Milk!
Worksheet
Reading Pictographs: Drink Your Milk!
Can your child help Tommy figure out how much milk he drinks? As she does, she'll learn how to read and interpret data in graphs and practice multiplication.
Third Grade
Data and Graphing
Worksheet
Make Math Fun with Buttons!
Activity
Make Math Fun with Buttons!
Kindergarten
Place Value
Have a lot of loose buttons lying around the house? Here are four ways to turn those loose buttons into an easy and positive learning experience. Button up!
Activity
Make Math Fun with Buttons!
Activity
Make Math Fun with Buttons!
Have a lot of loose buttons lying around the house? Here are four ways to turn those loose buttons into an easy and positive learning experience. Button up!
Kindergarten
Place Value
Activity
Mighty Mean, Median, and Mode
Lesson Plan
Mighty Mean, Median, and Mode
Fourth Grade
Data and Graphing
Give your students a good basis in interpreting data with this lesson that teaches them about mean, median, and mode with plenty of practice and cute videos to keep them interested.
Lesson Plan
Mighty Mean, Median, and Mode
Lesson Plan
Mighty Mean, Median, and Mode
Give your students a good basis in interpreting data with this lesson that teaches them about mean, median, and mode with plenty of practice and cute videos to keep them interested.
Fourth Grade
Data and Graphing
Lesson Plan
Reading Pictographs: Going to the Theater
Worksheet
Reading Pictographs: Going to the Theater
Third Grade
Data and Graphing
In this 3rd grade math worksheet, kids practice interpreting graph data as they use the information in a pictograph to answer a set of questions.
Worksheet
Reading Pictographs: Going to the Theater
Worksheet
Reading Pictographs: Going to the Theater
In this 3rd grade math worksheet, kids practice interpreting graph data as they use the information in a pictograph to answer a set of questions.
Third Grade
Data and Graphing
Worksheet
Math + Love = Valentine's Day Bar Graph
Lesson Plan
Math + Love = Valentine's Day Bar Graph
Second Grade
Data and Graphing
What's more romantic than a bar graph on Valentine's Day? In this Valentine's Day lesson plan, students will use information from a data set to create their own tally charts and bar graphs and then analyze these graphs to answer questions.
Lesson Plan
Math + Love = Valentine's Day Bar Graph
Lesson Plan
Math + Love = Valentine's Day Bar Graph
What's more romantic than a bar graph on Valentine's Day? In this Valentine's Day lesson plan, students will use information from a data set to create their own tally charts and bar graphs and then analyze these graphs to answer questions.
Second Grade
Data and Graphing
Lesson Plan
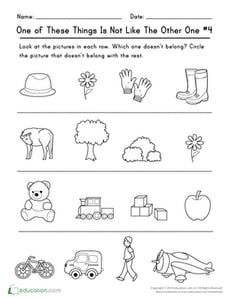
One of These Things Is Not Like The Other One (Part Four)
Worksheet
One of These Things Is Not Like The Other One (Part Four)
Kindergarten
Data and Graphing
This worksheet will challenge your students to think about the differences and similarities within a group of objects.
Worksheet
One of These Things Is Not Like The Other One (Part Four)
Worksheet
One of These Things Is Not Like The Other One (Part Four)
This worksheet will challenge your students to think about the differences and similarities within a group of objects.
Kindergarten
Data and Graphing
Worksheet
Comparing Pictographs: Football Time
Worksheet
Comparing Pictographs: Football Time
Third Grade
Data and Graphing
In this math worksheet, kids compare two pictographs that record the number of footballs kicked and the number of footballs thrown on the field.
Worksheet
Comparing Pictographs: Football Time
Worksheet
Comparing Pictographs: Football Time
In this math worksheet, kids compare two pictographs that record the number of footballs kicked and the number of footballs thrown on the field.
Third Grade
Data and Graphing
Worksheet
Backyard Bugs
Activity
Backyard Bugs
First Grade
Data and Graphing
Want to boost math and science learning? Take a bug expedition and give your first grader practice observing and charting what they see.
Activity
Backyard Bugs
Activity
Backyard Bugs
Want to boost math and science learning? Take a bug expedition and give your first grader practice observing and charting what they see.
First Grade
Data and Graphing
Activity
Practice Reading Venn Diagrams #1: Favorite Hobby
Worksheet
Practice Reading Venn Diagrams #1: Favorite Hobby
Second Grade
Data and Graphing
Kids practice reading a Venn diagram about favorite hobbies and answer questions about it in this 2nd grade math worksheet.
Worksheet
Practice Reading Venn Diagrams #1: Favorite Hobby
Worksheet
Practice Reading Venn Diagrams #1: Favorite Hobby
Kids practice reading a Venn diagram about favorite hobbies and answer questions about it in this 2nd grade math worksheet.
Second Grade
Data and Graphing
Worksheet
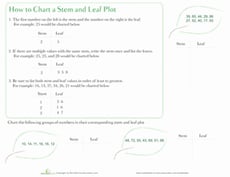
Stem and Leaf Plot
Worksheet
Stem and Leaf Plot
Third Grade
Data and Graphing
Nature is all around you -- even in your math textbooks! Get to the bottom of stem and leaf plots with this helpful worksheet.
Worksheet
Stem and Leaf Plot
Worksheet
Stem and Leaf Plot
Nature is all around you -- even in your math textbooks! Get to the bottom of stem and leaf plots with this helpful worksheet.
Third Grade
Data and Graphing
Worksheet
Practice Reading Venn Diagrams #3: Favorite Dessert
Worksheet
Practice Reading Venn Diagrams #3: Favorite Dessert
Second Grade
Data and Graphing
Kids practice reading a Venn diagram about favorite desserts and answer questions about it in this 2nd grade math worksheet.
Worksheet
Practice Reading Venn Diagrams #3: Favorite Dessert
Worksheet
Practice Reading Venn Diagrams #3: Favorite Dessert
Kids practice reading a Venn diagram about favorite desserts and answer questions about it in this 2nd grade math worksheet.
Second Grade
Data and Graphing
Worksheet
Practice Reading Venn Diagrams #2: In the Orchestra
Worksheet
Practice Reading Venn Diagrams #2: In the Orchestra
Second Grade
Data and Graphing
Kids practice reading a Venn diagram about instruments in an orchestra and answering questions about it in this 2nd grade math worksheet.
Worksheet
Practice Reading Venn Diagrams #2: In the Orchestra
Worksheet
Practice Reading Venn Diagrams #2: In the Orchestra
Kids practice reading a Venn diagram about instruments in an orchestra and answering questions about it in this 2nd grade math worksheet.
Second Grade
Data and Graphing
Worksheet
Picture Graphing with Fish
Game
Picture Graphing with Fish
Third Grade
Data and Graphing
Fish, fish everywhere! Kids catch fish to sort and graph in this zany game.
Game
Picture Graphing with Fish
Game
Picture Graphing with Fish
Fish, fish everywhere! Kids catch fish to sort and graph in this zany game.
Third Grade
Data and Graphing
Game
Graph My Design
Worksheet
Graph My Design
First Grade
Data and Graphing
Students build a design and then use this bar graph to show how many of each shape was used. Place inside a sheet protector to reuse.
Worksheet
Graph My Design
Worksheet
Graph My Design
Students build a design and then use this bar graph to show how many of each shape was used. Place inside a sheet protector to reuse.
First Grade
Data and Graphing
Worksheet
Ice Cream Graph #19
Worksheet
Ice Cream Graph #19
First Grade
Data and Graphing
Ice cream for sale! Sam, Kate, and Becky need help keeping track of how many ice cream cones they've sold. Your child will complete a pictograph to help them.
Worksheet
Ice Cream Graph #19
Worksheet
Ice Cream Graph #19
Ice cream for sale! Sam, Kate, and Becky need help keeping track of how many ice cream cones they've sold. Your child will complete a pictograph to help them.
First Grade
Data and Graphing
Worksheet
Ice Cream Bar Graph #9
Worksheet
Ice Cream Bar Graph #9
First Grade
Data and Graphing
Sam, Kate, and Becky have just had a long day of selling ice cream cones, and they want to know how many were sold. Help them with this pictograph worksheet.
Worksheet
Ice Cream Bar Graph #9
Worksheet
Ice Cream Bar Graph #9
Sam, Kate, and Becky have just had a long day of selling ice cream cones, and they want to know how many were sold. Help them with this pictograph worksheet.
First Grade
Data and Graphing
Worksheet
Make a Venn Diagram: Gift Boxes
Worksheet
Make a Venn Diagram: Gift Boxes
Second Grade
Data and Graphing
Kids practice making a Venn diagram about kinds of gift wrap by sorting the gifts in their correct spaces in this 2nd grade math worksheet.
Worksheet
Make a Venn Diagram: Gift Boxes
Worksheet
Make a Venn Diagram: Gift Boxes
Kids practice making a Venn diagram about kinds of gift wrap by sorting the gifts in their correct spaces in this 2nd grade math worksheet.
Second Grade
Data and Graphing
Worksheet
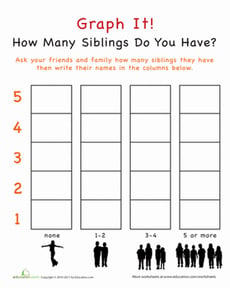
Graph It! How Many Siblings Do You Have?
Worksheet
Graph It! How Many Siblings Do You Have?
Kindergarten
Data and Graphing
Use this Graph It! worksheet to show your child the practical side of math. This graphing exercise gets your child to survey his friends on their siblings.
Worksheet
Graph It! How Many Siblings Do You Have?
Worksheet
Graph It! How Many Siblings Do You Have?
Use this Graph It! worksheet to show your child the practical side of math. This graphing exercise gets your child to survey his friends on their siblings.
Kindergarten
Data and Graphing
Worksheet
Graph Practice
Interactive Worksheet
Graph Practice
Second Grade
Data and Graphing
Don't let your second grader forget graphs! Be sure to review how to read a bar graph and pictograph with help from this handy worksheet. Challenge your young mathematician to read the graphs and answer some questions.
Interactive Worksheet
Graph Practice
Interactive Worksheet
Graph Practice
Don't let your second grader forget graphs! Be sure to review how to read a bar graph and pictograph with help from this handy worksheet. Challenge your young mathematician to read the graphs and answer some questions.
Second Grade
Data and Graphing
Interactive Worksheet
Interpreting Line Plots with Fractional Units
Worksheet
Interpreting Line Plots with Fractional Units
Third Grade
Data and Graphing
In this third grade worksheet, kids will interpret a line plot that includes fractional units.
Worksheet
Interpreting Line Plots with Fractional Units
Worksheet
Interpreting Line Plots with Fractional Units
In this third grade worksheet, kids will interpret a line plot that includes fractional units.
Third Grade
Data and Graphing
Worksheet
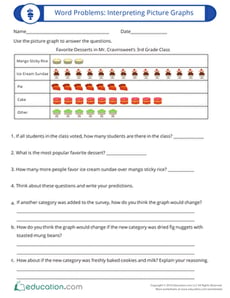
Word Problems: Interpreting Picture Graphs
Worksheet
Word Problems: Interpreting Picture Graphs
Third Grade
Data and Graphing
Students will cultivate the skills of reading, interpreting and analyzing picture graphs with this word problem that activates higher order thinking.
Worksheet
Word Problems: Interpreting Picture Graphs
Worksheet
Word Problems: Interpreting Picture Graphs
Students will cultivate the skills of reading, interpreting and analyzing picture graphs with this word problem that activates higher order thinking.
Third Grade
Data and Graphing
Worksheet
Winter Sports: Practice Reading a Bar Graph
Worksheet
Winter Sports: Practice Reading a Bar Graph
Second Grade
Data and Graphing
Children will practice interpreting a bar graph in this winter sports–themed math worksheet.
Worksheet
Winter Sports: Practice Reading a Bar Graph
Worksheet
Winter Sports: Practice Reading a Bar Graph
Children will practice interpreting a bar graph in this winter sports–themed math worksheet.
Second Grade
Data and Graphing
Worksheet
Word Problems: Interpreting Line Plots
Worksheet
Word Problems: Interpreting Line Plots
Second Grade
Data and Graphing
Students will have a chance to practice solving word problems using line plots with this worksheet.
Worksheet
Word Problems: Interpreting Line Plots
Worksheet
Word Problems: Interpreting Line Plots
Students will have a chance to practice solving word problems using line plots with this worksheet.
Second Grade
Data and Graphing
Worksheet
Ice Cream Graph #11
Worksheet
Ice Cream Graph #11
First Grade
Data and Graphing
Sam, Kate and Becky are having an ice cream sale. Help them keep track of their sales by filling in a pictograph, and then answer a few math questions.
Worksheet
Ice Cream Graph #11
Worksheet
Ice Cream Graph #11
Sam, Kate and Becky are having an ice cream sale. Help them keep track of their sales by filling in a pictograph, and then answer a few math questions.
First Grade
Data and Graphing
Worksheet
Ice Cream Graph #16
Worksheet
Ice Cream Graph #16
First Grade
Data and Graphing
Sam, Kate and Becky are having an ice cream sale. Help them keep track of their sales by drawing in a pictograph, and then answer a few math questions.
Worksheet
Ice Cream Graph #16
Worksheet
Ice Cream Graph #16
Sam, Kate and Becky are having an ice cream sale. Help them keep track of their sales by drawing in a pictograph, and then answer a few math questions.
First Grade
Data and Graphing
Worksheet
1
2
3
4
5
6
7