SKIP TO CONTENT
Worksheet Generator
Subjects
Grades
Worksheets
Games
Build a Worksheet
More Resources
Roly Recommends
Reading Month
Subjects
Grades
Worksheets
Games
Build a Worksheet
More Resources
Roly Recommends
Reading Month
All Subjects
Math
Data and Graphing
Subtopics:
Collecting and Organizing Data
Picture Graphs
Bar Graphs
Line Plots
Show Less
Filters
Search for: about, press
✕
Math
✕
Kindergarten - 3rd Grade
✕
Subjects
Math
English Language Arts
Science
Social Studies
Foreign Language
Grade Level
Pre-K
K
1st
2nd
3rd
4th
5th
6th
7th
8th
Early Childhood
Elementary School
Middle School
Resource Type
Worksheets
Games
Lesson Plans
Activities
Songs
Offline Games
Guided Lessons
Occasion
Birthdays
St. Patrick's Day
Summer
Back to School
Fall
Halloween
Winter
Holidays
Thanksgiving
Hanukkah
Lunar New Year
Valentine's Day
Common Core
Yes
Game Type
Ball Games
Arts & Crafts
Arts & Crafts
Construction & Sculpture
English Language Support
Yes
See More
Clear All
View 99 results
Showing Results for about press : Page 3
99 results
Search for: about, press
✕
Math
✕
Kindergarten - 3rd Grade
✕
Clear All
Sort by:
Relevance
Most recent
Most popular
Alphabetical A-Z
Alphabetical Z-A
All filters
99 results
Sort by:
Relevance
Most recent
Most popular
Alphabetical A-Z
Alphabetical Z-A
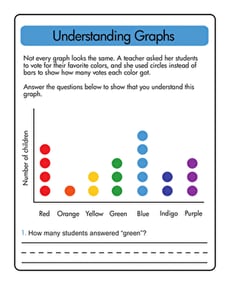
Understanding Graphs
Worksheet
Understanding Graphs
First Grade
Data and Graphing
Test your first grader's understanding of graphs and the information they provide with this worksheet.
Worksheet
Understanding Graphs
Worksheet
Understanding Graphs
Test your first grader's understanding of graphs and the information they provide with this worksheet.
First Grade
Data and Graphing
Worksheet
What is it Telling Me? Creating and Interpreting Line Plots
Lesson Plan
What is it Telling Me? Creating and Interpreting Line Plots
Third Grade
Data and Graphing
Line plots are a great way to introduce your students to graphing data. In this lesson, your students will learn how to create a line plot and also practice interpreting line plots.
Lesson Plan
What is it Telling Me? Creating and Interpreting Line Plots
Lesson Plan
What is it Telling Me? Creating and Interpreting Line Plots
Line plots are a great way to introduce your students to graphing data. In this lesson, your students will learn how to create a line plot and also practice interpreting line plots.
Third Grade
Data and Graphing
Lesson Plan
Do a Survey! Favorite Veggies
Worksheet
Do a Survey! Favorite Veggies
Second Grade
Data and Graphing
Give your second grader some practice working with data with this fun-to-complete favorite veggie survey.
Worksheet
Do a Survey! Favorite Veggies
Worksheet
Do a Survey! Favorite Veggies
Give your second grader some practice working with data with this fun-to-complete favorite veggie survey.
Second Grade
Data and Graphing
Worksheet
Ice Cream Bar Graph #2
Worksheet
Ice Cream Bar Graph #2
First Grade
Data and Graphing
Help keep track of ice cream sales with some bar graph practice! Your child will have a scoop full of fun figuring out which friend sold the most ice cream.
Worksheet
Ice Cream Bar Graph #2
Worksheet
Ice Cream Bar Graph #2
Help keep track of ice cream sales with some bar graph practice! Your child will have a scoop full of fun figuring out which friend sold the most ice cream.
First Grade
Data and Graphing
Worksheet
Digital Algebra
Activity
Digital Algebra
Kindergarten
Geometry
Kindergarten algebra is a lot different than high school. In kindergarten math, algebra means grouping like things, or noticing what doesn't belong in a set.
Activity
Digital Algebra
Activity
Digital Algebra
Kindergarten algebra is a lot different than high school. In kindergarten math, algebra means grouping like things, or noticing what doesn't belong in a set.
Kindergarten
Geometry
Activity
Graph My Design
Worksheet
Graph My Design
First Grade
Data and Graphing
Students build a design and then use this bar graph to show how many of each shape was used. Place inside a sheet protector to reuse.
Worksheet
Graph My Design
Worksheet
Graph My Design
Students build a design and then use this bar graph to show how many of each shape was used. Place inside a sheet protector to reuse.
First Grade
Data and Graphing
Worksheet
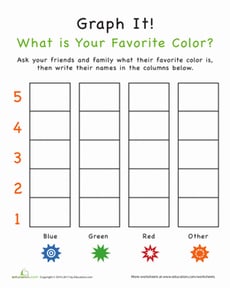
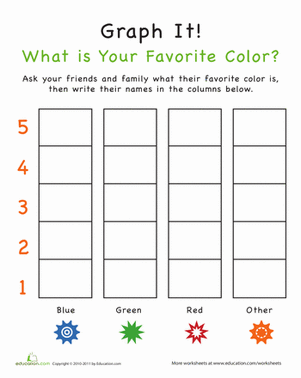
Graph It! What is Your Favorite Color?
Worksheet
Graph It! What is Your Favorite Color?
Kindergarten
Data and Graphing
Show your child the practical uses of math with this Graph It! worksheet. Your child will graph his friends' favorite colors in this graphing worksheet.
Worksheet
Graph It! What is Your Favorite Color?
Worksheet
Graph It! What is Your Favorite Color?
Show your child the practical uses of math with this Graph It! worksheet. Your child will graph his friends' favorite colors in this graphing worksheet.
Kindergarten
Data and Graphing
Worksheet
Food Is Fantastic: Healthy or Not Healthy?
Worksheet
Food Is Fantastic: Healthy or Not Healthy?
Kindergarten
Data and Graphing
Get kids started on eating right with this printable activity. Cut out the pictures of the different foods and paste just the healthy ones onto the plate.
Worksheet
Food Is Fantastic: Healthy or Not Healthy?
Worksheet
Food Is Fantastic: Healthy or Not Healthy?
Get kids started on eating right with this printable activity. Cut out the pictures of the different foods and paste just the healthy ones onto the plate.
Kindergarten
Data and Graphing
Worksheet
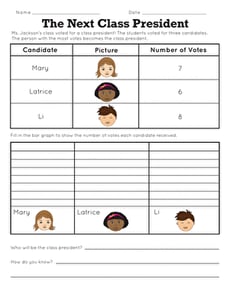
The Next Class President
Worksheet
The Next Class President
Second Grade
Numbers and Counting
In this beginning data and graphing worksheet, kindergartners and first graders get an introduction to the process of voting and outcomes.
Worksheet
The Next Class President
Worksheet
The Next Class President
In this beginning data and graphing worksheet, kindergartners and first graders get an introduction to the process of voting and outcomes.
Second Grade
Numbers and Counting
Worksheet
Graphing Data: Colors
Worksheet
Graphing Data: Colors
Second Grade
Data and Graphing
Help the concept of graphing really sink in by challenging your second grader to graph kids' favorite colors using a table, tally mark table, and grid.
Worksheet
Graphing Data: Colors
Worksheet
Graphing Data: Colors
Help the concept of graphing really sink in by challenging your second grader to graph kids' favorite colors using a table, tally mark table, and grid.
Second Grade
Data and Graphing
Worksheet
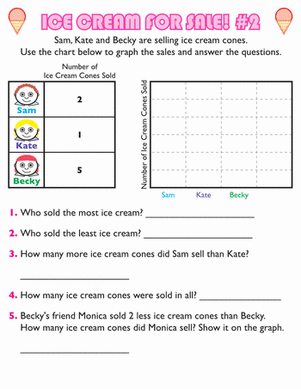
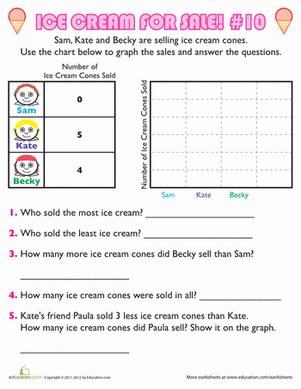
Ice Cream Bar Graph #10
Worksheet
Ice Cream Bar Graph #10
First Grade
Data and Graphing
Sam, Kate, and Becky need help keeping track of their ice cream sales. Practice using bar graphs, addition, and subtraction in this ice cream themed worksheet.
Worksheet
Ice Cream Bar Graph #10
Worksheet
Ice Cream Bar Graph #10
Sam, Kate, and Becky need help keeping track of their ice cream sales. Practice using bar graphs, addition, and subtraction in this ice cream themed worksheet.
First Grade
Data and Graphing
Worksheet
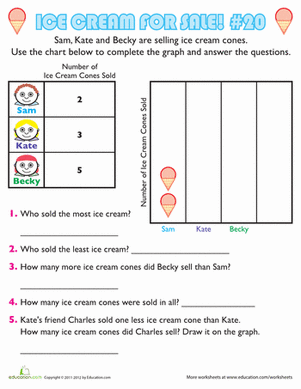
Ice Cream Graph #20
Worksheet
Ice Cream Graph #20
First Grade
Data and Graphing
Young entrepreneurs Sam, Kate, and Becky sold some ice cream cones, but they need help figuring out how many. Exercise pictograph skills in this worksheet.
Worksheet
Ice Cream Graph #20
Worksheet
Ice Cream Graph #20
Young entrepreneurs Sam, Kate, and Becky sold some ice cream cones, but they need help figuring out how many. Exercise pictograph skills in this worksheet.
First Grade
Data and Graphing
Worksheet
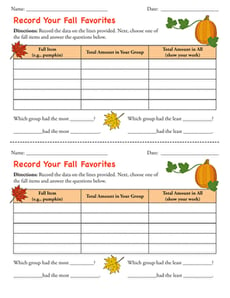
Record Your Fall Favorites
Worksheet
Record Your Fall Favorites
Second Grade
Data and Graphing
Use this template alongside the engaging lesson, “Let’s Graph Our Fall Favorites” to support kids in interpreting data.
Worksheet
Record Your Fall Favorites
Worksheet
Record Your Fall Favorites
Use this template alongside the engaging lesson, “Let’s Graph Our Fall Favorites” to support kids in interpreting data.
Second Grade
Data and Graphing
Worksheet
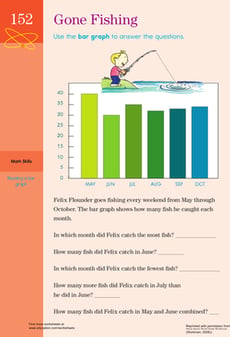
Getting Graphs: Gone Fishing!
Worksheet
Getting Graphs: Gone Fishing!
Third Grade
Data and Graphing
Hunting for a worksheet to help your kid with graphs? This printable helps your child to understand bar graphs.
Worksheet
Getting Graphs: Gone Fishing!
Worksheet
Getting Graphs: Gone Fishing!
Hunting for a worksheet to help your kid with graphs? This printable helps your child to understand bar graphs.
Third Grade
Data and Graphing
Worksheet
Creating a Bar Graph: Favorite Picnic Spots
Worksheet
Creating a Bar Graph: Favorite Picnic Spots
Second Grade
Data and Graphing
Learners practice charting and graphing data in this hands-on worksheet.
Worksheet
Creating a Bar Graph: Favorite Picnic Spots
Worksheet
Creating a Bar Graph: Favorite Picnic Spots
Learners practice charting and graphing data in this hands-on worksheet.
Second Grade
Data and Graphing
Worksheet
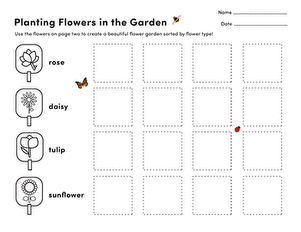
Plant a Flower Garden
Worksheet
Plant a Flower Garden
Kindergarten
Data and Graphing
Plant a paper flower garden with this fun sorting activity! Children color the flowers, then cut them out and sort them by type.
Worksheet
Plant a Flower Garden
Worksheet
Plant a Flower Garden
Plant a paper flower garden with this fun sorting activity! Children color the flowers, then cut them out and sort them by type.
Kindergarten
Data and Graphing
Worksheet
Tally Time: At the Farmers Market
Worksheet
Tally Time: At the Farmers Market
First Grade
Data and Graphing
The farmer needs help keeping track of his vegetables. Can your child use her counting skills to give him a hand?
Worksheet
Tally Time: At the Farmers Market
Worksheet
Tally Time: At the Farmers Market
The farmer needs help keeping track of his vegetables. Can your child use her counting skills to give him a hand?
First Grade
Data and Graphing
Worksheet
Favorite Cities Bar Graph
Worksheet
Favorite Cities Bar Graph
Second Grade
Data and Graphing
Can your second grader make her own bar chart? Use this pretend survey of 38 people and their favorite cities to find out!
Worksheet
Favorite Cities Bar Graph
Worksheet
Favorite Cities Bar Graph
Can your second grader make her own bar chart? Use this pretend survey of 38 people and their favorite cities to find out!
Second Grade
Data and Graphing
Worksheet
Using a Chart: Do Your Chores!
Worksheet
Using a Chart: Do Your Chores!
Third Grade
Data and Graphing
Kids completing this third grade math worksheet use a chart to compare data and solve addition problems.
Worksheet
Using a Chart: Do Your Chores!
Worksheet
Using a Chart: Do Your Chores!
Kids completing this third grade math worksheet use a chart to compare data and solve addition problems.
Third Grade
Data and Graphing
Worksheet
Why Do Leaves Change Color?
Activity
Why Do Leaves Change Color?
Second Grade
Data and Graphing
Engage your children with this fun fall activity that integrates math and science. First, your child will excavate to find leaves. Next, they'll examine them to determine the colors. Then, your child will graph their findings.
Activity
Why Do Leaves Change Color?
Activity
Why Do Leaves Change Color?
Engage your children with this fun fall activity that integrates math and science. First, your child will excavate to find leaves. Next, they'll examine them to determine the colors. Then, your child will graph their findings.
Second Grade
Data and Graphing
Activity
Graph My Design
Lesson Plan
Graph My Design
First Grade
Geometry
Geometry meets data in this fun lesson! Students will build a design using pattern blocks and then graph the number of each shape used. This scaffolded EL lesson can be used alone or alongside
Graphing Colored Counters.
Lesson Plan
Graph My Design
Lesson Plan
Graph My Design
Geometry meets data in this fun lesson! Students will build a design using pattern blocks and then graph the number of each shape used. This scaffolded EL lesson can be used alone or alongside
Graphing Colored Counters.
First Grade
Geometry
Lesson Plan
Math + Love = Valentine's Day Bar Graph
Lesson Plan
Math + Love = Valentine's Day Bar Graph
Second Grade
Data and Graphing
What's more romantic than a bar graph on Valentine's Day? In this Valentine's Day lesson plan, students will use information from a data set to create their own tally charts and bar graphs and then analyze these graphs to answer questions.
Lesson Plan
Math + Love = Valentine's Day Bar Graph
Lesson Plan
Math + Love = Valentine's Day Bar Graph
What's more romantic than a bar graph on Valentine's Day? In this Valentine's Day lesson plan, students will use information from a data set to create their own tally charts and bar graphs and then analyze these graphs to answer questions.
Second Grade
Data and Graphing
Lesson Plan
Build a Bar Graph: Favorite Wild Animals
Worksheet
Build a Bar Graph: Favorite Wild Animals
Second Grade
Data and Graphing
Analyze a bar graph with this second-grade worksheet!
Worksheet
Build a Bar Graph: Favorite Wild Animals
Worksheet
Build a Bar Graph: Favorite Wild Animals
Analyze a bar graph with this second-grade worksheet!
Second Grade
Data and Graphing
Worksheet
Using Election Data
Worksheet
Using Election Data
Second Grade
Data and Graphing
Practice reading election data with this data analysis worksheet!
Worksheet
Using Election Data
Worksheet
Using Election Data
Practice reading election data with this data analysis worksheet!
Second Grade
Data and Graphing
Worksheet
Probability Game
Activity
Probability Game
Third Grade
Data and Graphing
Probability can be a tough concept to master. Try playing this fun card game in order to help your third grader understand it a little better.
Activity
Probability Game
Activity
Probability Game
Probability can be a tough concept to master. Try playing this fun card game in order to help your third grader understand it a little better.
Third Grade
Data and Graphing
Activity
Create a Gumdrop Topiary
Activity
Create a Gumdrop Topiary
Kindergarten
Place Value
Here's a fun math-oriented arts and crafts activity for your preschool or kindergarten child: create a gumdrop topiary and practice counting along the way.
Activity
Create a Gumdrop Topiary
Activity
Create a Gumdrop Topiary
Here's a fun math-oriented arts and crafts activity for your preschool or kindergarten child: create a gumdrop topiary and practice counting along the way.
Kindergarten
Place Value
Activity
Start a Survey!
Activity
Start a Survey!
Kindergarten
Data and Graphing
Put your kid in charge of her own survey! She'll poll her relatives and friends, collect information, and then create a colorful chart to display her findings.
Activity
Start a Survey!
Activity
Start a Survey!
Put your kid in charge of her own survey! She'll poll her relatives and friends, collect information, and then create a colorful chart to display her findings.
Kindergarten
Data and Graphing
Activity
Create a Family Graph!
Activity
Create a Family Graph!
Third Grade
Data and Graphing
Create a graph based on the interests of family member's to see who has what in common. Your child will practice her math skills and get to know the family!
Activity
Create a Family Graph!
Activity
Create a Family Graph!
Create a graph based on the interests of family member's to see who has what in common. Your child will practice her math skills and get to know the family!
Third Grade
Data and Graphing
Activity
Bar Graphs: Interpreting Data
Lesson Plan
Bar Graphs: Interpreting Data
Second Grade
Data and Graphing
In this lesson, students will make bar graphs and interpret data using real-life data from other students. They will get practice writing and answering survey questions.
Lesson Plan
Bar Graphs: Interpreting Data
Lesson Plan
Bar Graphs: Interpreting Data
In this lesson, students will make bar graphs and interpret data using real-life data from other students. They will get practice writing and answering survey questions.
Second Grade
Data and Graphing
Lesson Plan
Make Math Fun with Buttons!
Activity
Make Math Fun with Buttons!
Kindergarten
Place Value
Have a lot of loose buttons lying around the house? Here are four ways to turn those loose buttons into an easy and positive learning experience. Button up!
Activity
Make Math Fun with Buttons!
Activity
Make Math Fun with Buttons!
Have a lot of loose buttons lying around the house? Here are four ways to turn those loose buttons into an easy and positive learning experience. Button up!
Kindergarten
Place Value
Activity
1
2
3
4