SKIP TO CONTENT
Worksheet Generator
Subjects
Grades
Worksheets
Games
Build a Worksheet
More Resources
Roly Recommends
Subjects
Grades
Worksheets
Games
Build a Worksheet
More Resources
Roly Recommends
All Subjects
Math
Statistics
Subtopics:
Statistical Questions
Mean, Median, and Mode
Range and Mean Absolute Deviation
✕
Statistics Word Problems
Show Less
Filters
Search for: ready, set, read
✕
Math
✕
6th Grade
✕
Common Core
✕
Subjects
Math
English Language Arts
Science
Social Studies
Grade Level
Pre-K
K
1st
2nd
3rd
4th
5th
6th
7th
8th
Early Childhood
Elementary School
Middle School
Resource Type
Worksheets
Interactive Worksheets
Common Core
Yes
See More
Clear All
View 8 results
Showing Results for ready set read
8 results
Search for: ready, set, read
✕
Math
✕
6th Grade
✕
Common Core
✕
Clear All
Sort by:
Relevance
Most recent
Most popular
Alphabetical A-Z
Alphabetical Z-A
All filters
8 results
Sort by:
Relevance
Most recent
Most popular
Alphabetical A-Z
Alphabetical Z-A
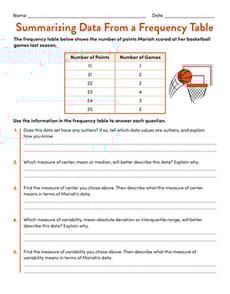
Summarizing Data From a Frequency Table
Worksheet
Summarizing Data From a Frequency Table
Sixth Grade
Data and Graphing
Practice summarizing a numerical data set with this one-page statistics worksheet!
Worksheet
Summarizing Data From a Frequency Table
Worksheet
Summarizing Data From a Frequency Table
Practice summarizing a numerical data set with this one-page statistics worksheet!
Sixth Grade
Data and Graphing
Worksheet
Practice Finding Range
Worksheet
Practice Finding Range
Sixth Grade
Data and Graphing
Give your students practice finding the range of a data set with this sixth-grade data and graphing worksheet!
Worksheet
Practice Finding Range
Worksheet
Practice Finding Range
Give your students practice finding the range of a data set with this sixth-grade data and graphing worksheet!
Sixth Grade
Data and Graphing
Worksheet
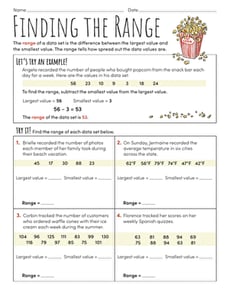
Finding the Range
Interactive Worksheet
Finding the Range
Sixth Grade
Statistics
Introduce students to ranges and data sets with this middle grades math worksheet!
Interactive Worksheet
Finding the Range
Interactive Worksheet
Finding the Range
Introduce students to ranges and data sets with this middle grades math worksheet!
Sixth Grade
Statistics
Interactive Worksheet
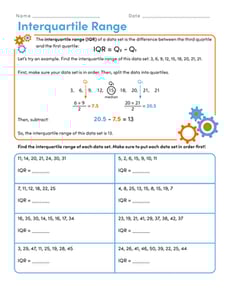
Interquartile Range
Interactive Worksheet
Interquartile Range
Sixth Grade
Statistics
In this sixth-grade statistics worksheet, students will practice finding the interquartile range of data sets.
Interactive Worksheet
Interquartile Range
Interactive Worksheet
Interquartile Range
In this sixth-grade statistics worksheet, students will practice finding the interquartile range of data sets.
Sixth Grade
Statistics
Interactive Worksheet
Mean Absolute Deviation
Worksheet
Mean Absolute Deviation
Sixth Grade
Data and Graphing
Students calculate the mean absolute deviation of data sets in this sixth-grade date and graphing worksheet.
Worksheet
Mean Absolute Deviation
Worksheet
Mean Absolute Deviation
Students calculate the mean absolute deviation of data sets in this sixth-grade date and graphing worksheet.
Sixth Grade
Data and Graphing
Worksheet
Describing Distributions in Dot Plots
Worksheet
Describing Distributions in Dot Plots
Sixth Grade
Data and Graphing
Students explore distributions in dot plots with this sixth-grade statistics worksheet!
Worksheet
Describing Distributions in Dot Plots
Worksheet
Describing Distributions in Dot Plots
Students explore distributions in dot plots with this sixth-grade statistics worksheet!
Sixth Grade
Data and Graphing
Worksheet
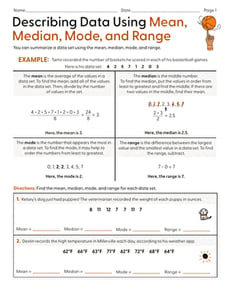
Describing Data Using Mean, Median, Mode, and Range
Worksheet
Describing Data Using Mean, Median, Mode, and Range
Sixth Grade
Statistics
Students describe data using measures of center and a measure of variability in this statistics worksheet for middle grades!
Worksheet
Describing Data Using Mean, Median, Mode, and Range
Worksheet
Describing Data Using Mean, Median, Mode, and Range
Students describe data using measures of center and a measure of variability in this statistics worksheet for middle grades!
Sixth Grade
Statistics
Worksheet
Describing Distributions in Histograms
Worksheet
Describing Distributions in Histograms
Sixth Grade
Data and Graphing
Help students deepen their understanding of histograms with this this two-page data and graphing worksheet!
Worksheet
Describing Distributions in Histograms
Worksheet
Describing Distributions in Histograms
Help students deepen their understanding of histograms with this this two-page data and graphing worksheet!
Sixth Grade
Data and Graphing
Worksheet
1