SKIP TO CONTENT
Worksheet Generator
Subjects
Grades
Worksheets
Games
Build a Worksheet
More Resources
Roly Recommends
Subjects
Grades
Worksheets
Games
Build a Worksheet
More Resources
Roly Recommends
All Subjects
Math
Data and Graphing
Subtopics:
Collecting and Organizing Data
Bar Graphs
Show Less
Filters
Search for: page, screen, learning, comprehension, movies
✕
Math
✕
4th Grade
✕
Subjects
Math
English Language Arts
Science
Social Studies
Foreign Language
Grade Level
Pre-K
K
1st
2nd
3rd
4th
5th
6th
7th
8th
Early Childhood
Elementary School
Middle School
Resource Type
Worksheets
Lesson Plans
Guided Lessons
Common Core
Yes
See More
Clear All
View 5 results
Showing Results for page screen learning comprehension movies
5 results
Search for: page, screen, learning, comprehension, movies
✕
Math
✕
4th Grade
✕
Clear All
Sort by:
Relevance
Most recent
Most popular
Alphabetical A-Z
Alphabetical Z-A
All filters
5 results
Sort by:
Relevance
Most recent
Most popular
Alphabetical A-Z
Alphabetical Z-A
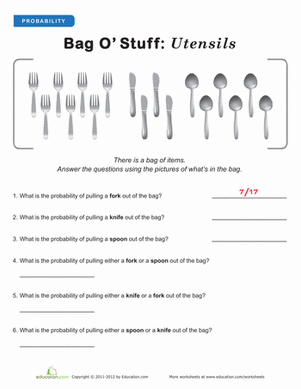
Intro to Probability: Utensils
Worksheet
Intro to Probability: Utensils
Fourth Grade
Data and Graphing
Serve yourself some knowledge with this probability worksheet! This great page will introduce your child to probability concepts.
Worksheet
Intro to Probability: Utensils
Worksheet
Intro to Probability: Utensils
Serve yourself some knowledge with this probability worksheet! This great page will introduce your child to probability concepts.
Fourth Grade
Data and Graphing
Worksheet
Measurement and Data 4
Guided Lesson
Measurement and Data 4
Fourth Grade
Fractions
Representing data on graphs makes math visual and involves some creativity and design. Plotting data using fractional units takes their learning one step further. Also in this unit, students learn to measure using both traditional units (like inches, feet and yards) and metric units, and how to convert measurements within each system. The concept of measurement gets two dimensional when students explore measuring and working with angles.
Guided Lesson
Measurement and Data 4
Guided Lesson
Measurement and Data 4
Representing data on graphs makes math visual and involves some creativity and design. Plotting data using fractional units takes their learning one step further. Also in this unit, students learn to measure using both traditional units (like inches, feet and yards) and metric units, and how to convert measurements within each system. The concept of measurement gets two dimensional when students explore measuring and working with angles.
Fourth Grade
Fractions
Guided Lesson
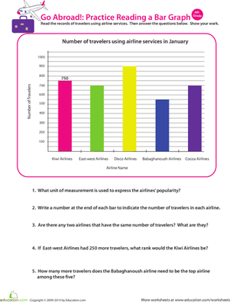
Going Abroad: Practice Reading a Bar Graph
Worksheet
Going Abroad: Practice Reading a Bar Graph
Fourth Grade
Data and Graphing
This 4th grade math worksheet will challenge your child's analytical thinking skills. He'll read a bar graph, then use its data to answer a set of questions.
Worksheet
Going Abroad: Practice Reading a Bar Graph
Worksheet
Going Abroad: Practice Reading a Bar Graph
This 4th grade math worksheet will challenge your child's analytical thinking skills. He'll read a bar graph, then use its data to answer a set of questions.
Fourth Grade
Data and Graphing
Worksheet
Mighty Mean, Median, and Mode
Lesson Plan
Mighty Mean, Median, and Mode
Fourth Grade
Data and Graphing
Give your students a good basis in interpreting data with this lesson that teaches them about mean, median, and mode with plenty of practice and cute videos to keep them interested.
Lesson Plan
Mighty Mean, Median, and Mode
Lesson Plan
Mighty Mean, Median, and Mode
Give your students a good basis in interpreting data with this lesson that teaches them about mean, median, and mode with plenty of practice and cute videos to keep them interested.
Fourth Grade
Data and Graphing
Lesson Plan
Mean, Median and Mode Madness!
Lesson Plan
Mean, Median and Mode Madness!
Third Grade
Data and Graphing
This lesson introduces students to the concepts of mean, median, and mode in a hands-on and visual way.
Lesson Plan
Mean, Median and Mode Madness!
Lesson Plan
Mean, Median and Mode Madness!
This lesson introduces students to the concepts of mean, median, and mode in a hands-on and visual way.
Third Grade
Data and Graphing
Lesson Plan
1