SKIP TO CONTENT
Worksheet Generator
Subjects
Grades
Worksheets
Games
Build a Worksheet
More Resources
Roly Recommends
Subjects
Grades
Worksheets
Games
Build a Worksheet
More Resources
Roly Recommends
Filters
Search for: results, in, interpreting, data
✕
4th and 5th Grade
✕
Subjects
Math
English Language Arts
Science
Social Studies
Grade Level
Pre-K
K
1st
2nd
3rd
4th
5th
6th
7th
8th
Early Childhood
Elementary School
Middle School
Resource Type
Worksheets
Lesson Plans
Interactive Worksheets
Workbooks
Activities
Exercises
Offline Games
Guided Lessons
Teacher Resources
See more
Occasion
Women's History Month
Spring
Easter
Earth Day
Memorial Day
Independence Day
Fall
Halloween
Veterans Day
Winter
Holidays
Christmas
Martin Luther King Jr. Day
Valentine's Day
Black History Month
See more
Common Core
Yes
No
Roly Recommends
Social Emotional Learning
Game Type
Outdoor Games
Puzzles & Sudoku
Travel Games
Word Puzzles
Arts & Crafts
Arts & Crafts
Fabric Projects
Paper & Glue Crafts
Construction & Sculpture
Painting & Drawing
Recycled Crafts
Recipes
Mains
English Language Support
Yes
See More
Clear All
View 448 results
Showing Results for results in interpreting data
448 results
Search for: results, in, interpreting, data
✕
4th and 5th Grade
✕
Clear All
Sort by:
Relevance
Most recent
Most popular
Alphabetical A-Z
Alphabetical Z-A
All filters
448 results
Sort by:
Relevance
Most recent
Most popular
Alphabetical A-Z
Alphabetical Z-A
Interpreting Data by Creating Graphs
Lesson Plan
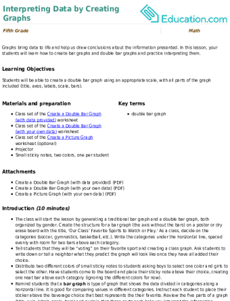
Interpreting Data by Creating Graphs
Fifth Grade
Graphs bring data to life and help us draw conclusions about the information presented. In this lesson, your students will learn how to create bar graphs and double bar graphs and practice interpreting them.
Lesson Plan
Interpreting Data by Creating Graphs
Lesson Plan
Interpreting Data by Creating Graphs
Graphs bring data to life and help us draw conclusions about the information presented. In this lesson, your students will learn how to create bar graphs and double bar graphs and practice interpreting them.
Fifth Grade
Lesson Plan
Data 2
Guided Lesson
Data 2
Fifth Grade
Fractions
Understanding data and graphs is a critical skill that we use on a regular basis to read news articles, reports and other media to interpret information. In this unit, students investigate data collection, data organization and visual representation in different kinds of graphics (i.e. line plots, pie charts). Learners also apply concepts of probability and statistics to analyze data.
Guided Lesson
Data 2
Guided Lesson
Data 2
Understanding data and graphs is a critical skill that we use on a regular basis to read news articles, reports and other media to interpret information. In this unit, students investigate data collection, data organization and visual representation in different kinds of graphics (i.e. line plots, pie charts). Learners also apply concepts of probability and statistics to analyze data.
Fifth Grade
Fractions
Guided Lesson
Donut Data
Worksheet
Donut Data
Fifth Grade
Data and Graphing
Practice using line plots and data sets to solve math problems with this donut-themed fractions worksheet!
Worksheet
Donut Data
Worksheet
Donut Data
Practice using line plots and data sets to solve math problems with this donut-themed fractions worksheet!
Fifth Grade
Data and Graphing
Worksheet
Measurement & Data Review
Worksheet
Measurement & Data Review
Fifth Grade
Fractions
Assess your students’ knowledge of fifth grade data and measurement concepts.
Worksheet
Measurement & Data Review
Worksheet
Measurement & Data Review
Assess your students’ knowledge of fifth grade data and measurement concepts.
Fifth Grade
Fractions
Worksheet
Collecting and Organizing Data 2
Exercise
Collecting and Organizing Data 2
Fourth Grade
Data and Graphing
Your students will grow adept at collecting and organizing data around them with this engaging exercise.
Exercise
Collecting and Organizing Data 2
Exercise
Collecting and Organizing Data 2
Your students will grow adept at collecting and organizing data around them with this engaging exercise.
Fourth Grade
Data and Graphing
Exercise
Interpreting Bar Chart Graphs
Worksheet
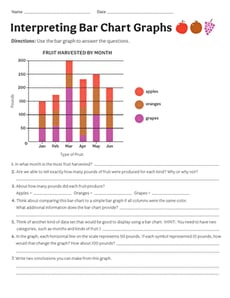
Interpreting Bar Chart Graphs
Fifth Grade
Data and Graphing
Learners practice using a bar graph to answer questions in this data and graphing worksheet.
Worksheet
Interpreting Bar Chart Graphs
Worksheet
Interpreting Bar Chart Graphs
Learners practice using a bar graph to answer questions in this data and graphing worksheet.
Fifth Grade
Data and Graphing
Worksheet
What Animals are Most Popular? A Data Analysis Project
Activity
What Animals are Most Popular? A Data Analysis Project
Second Grade
Engineering and Science Inquiry
What animals are most popular? This project affords practice in data-collection, record-keeping and data-analysis through the investigation of this question.
Activity
What Animals are Most Popular? A Data Analysis Project
Activity
What Animals are Most Popular? A Data Analysis Project
What animals are most popular? This project affords practice in data-collection, record-keeping and data-analysis through the investigation of this question.
Second Grade
Engineering and Science Inquiry
Activity
Collecting and Organizing Data 3
Exercise
Collecting and Organizing Data 3
Fifth Grade
Data and Graphing
By the time students complete this third exercise in the series, they will have become masters of collecting and organizing data.
Exercise
Collecting and Organizing Data 3
Exercise
Collecting and Organizing Data 3
By the time students complete this third exercise in the series, they will have become masters of collecting and organizing data.
Fifth Grade
Data and Graphing
Exercise
Measurement and Data 4
Guided Lesson
Measurement and Data 4
Fourth Grade
Fractions
Representing data on graphs makes math visual and involves some creativity and design. Plotting data using fractional units takes their learning one step further. Also in this unit, students learn to measure using both traditional units (like inches, feet and yards) and metric units, and how to convert measurements within each system. The concept of measurement gets two dimensional when students explore measuring and working with angles.
Guided Lesson
Measurement and Data 4
Guided Lesson
Measurement and Data 4
Representing data on graphs makes math visual and involves some creativity and design. Plotting data using fractional units takes their learning one step further. Also in this unit, students learn to measure using both traditional units (like inches, feet and yards) and metric units, and how to convert measurements within each system. The concept of measurement gets two dimensional when students explore measuring and working with angles.
Fourth Grade
Fractions
Guided Lesson
Create a Double Bar Graph (with data provided)
Worksheet
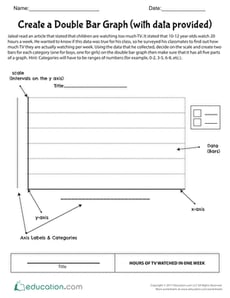
Create a Double Bar Graph (with data provided)
Fifth Grade
Data and Graphing
Ask your students to use data to create a double bar graph and interpret the graph with critical thinking.
Worksheet
Create a Double Bar Graph (with data provided)
Worksheet
Create a Double Bar Graph (with data provided)
Ask your students to use data to create a double bar graph and interpret the graph with critical thinking.
Fifth Grade
Data and Graphing
Worksheet
Interpreting Complex Graphs
Lesson Plan
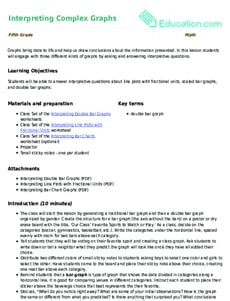
Interpreting Complex Graphs
Fifth Grade
Math
Graphs bring data to life and help us draw conclusions about the information presented. In this lesson students will engage with three different kinds of graphs by asking and answering interpretive questions.
Lesson Plan
Interpreting Complex Graphs
Lesson Plan
Interpreting Complex Graphs
Graphs bring data to life and help us draw conclusions about the information presented. In this lesson students will engage with three different kinds of graphs by asking and answering interpretive questions.
Fifth Grade
Math
Lesson Plan
Interpreting Double Bar Graphs
Worksheet
Interpreting Double Bar Graphs
Fifth Grade
Data and Graphing
Students will cultivate the skills of reading, interpreting, and analyzing bar graphs with these questions that activate higher order thinking.
Worksheet
Interpreting Double Bar Graphs
Worksheet
Interpreting Double Bar Graphs
Students will cultivate the skills of reading, interpreting, and analyzing bar graphs with these questions that activate higher order thinking.
Fifth Grade
Data and Graphing
Worksheet
Create a Picture Graph (with your own data)
Worksheet
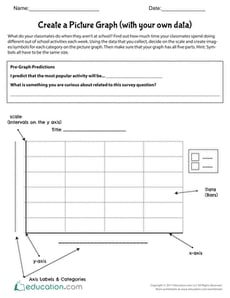
Create a Picture Graph (with your own data)
Fifth Grade
Data and Graphing
Using data that your students will generate in their class, they will create a picture graph that reflects how much time they spend doing different activities each week.
Worksheet
Create a Picture Graph (with your own data)
Worksheet
Create a Picture Graph (with your own data)
Using data that your students will generate in their class, they will create a picture graph that reflects how much time they spend doing different activities each week.
Fifth Grade
Data and Graphing
Worksheet
Census Data: Working for a Living 1
Worksheet
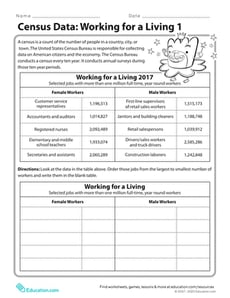
Census Data: Working for a Living 1
Fourth Grade
Math
Use the worksheet Census Data 2017: Working for a Living 1 to help learners order numbers from real-life data up to the millions place. Ask learners to compare and order the job and its total number of workers in the blank table from greatest to least.
Worksheet
Census Data: Working for a Living 1
Worksheet
Census Data: Working for a Living 1
Use the worksheet Census Data 2017: Working for a Living 1 to help learners order numbers from real-life data up to the millions place. Ask learners to compare and order the job and its total number of workers in the blank table from greatest to least.
Fourth Grade
Math
Worksheet
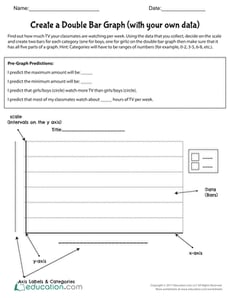
Create a Double Bar Graph (with your own data)
Worksheet
Create a Double Bar Graph (with your own data)
Fifth Grade
Data and Graphing
Students will collect data, create a double bar graph, and interpret the graph by responding to prompts that will get them thinking critically.
Worksheet
Create a Double Bar Graph (with your own data)
Worksheet
Create a Double Bar Graph (with your own data)
Students will collect data, create a double bar graph, and interpret the graph by responding to prompts that will get them thinking critically.
Fifth Grade
Data and Graphing
Worksheet
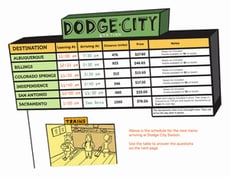
Data Chart: The Dodge City Train Station
Worksheet
Data Chart: The Dodge City Train Station
Fourth Grade
Measurement
Give your fourth-grader some real-world chart-reading practice with a familiar data chart: a train schedule!
Worksheet
Data Chart: The Dodge City Train Station
Worksheet
Data Chart: The Dodge City Train Station
Give your fourth-grader some real-world chart-reading practice with a familiar data chart: a train schedule!
Fourth Grade
Measurement
Worksheet
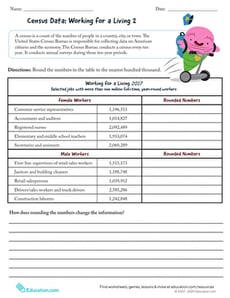
Census Data: Working for a Living 2
Worksheet
Census Data: Working for a Living 2
Fourth Grade
Place Value
Use the worksheet Census Data 2017: Working for a Living 2 to help learners round the total number of workers to the nearest hundred millions place.
Worksheet
Census Data: Working for a Living 2
Worksheet
Census Data: Working for a Living 2
Use the worksheet Census Data 2017: Working for a Living 2 to help learners round the total number of workers to the nearest hundred millions place.
Fourth Grade
Place Value
Worksheet
Poll Results
Worksheet
Poll Results
Fourth Grade
Imagine you were the U.S. president and decide where to stand on controversial issues. You can't please all the people all the time!
Worksheet
Poll Results
Worksheet
Poll Results
Imagine you were the U.S. president and decide where to stand on controversial issues. You can't please all the people all the time!
Fourth Grade
Worksheet
Smell & Taste
Activity
Smell & Taste
Fourth Grade
Life Science
Experiment about connection of senses of taste and smell. Using blindfold and noseplugs, administer blind taste test. Analyze results and organize data.
Activity
Smell & Taste
Activity
Smell & Taste
Experiment about connection of senses of taste and smell. Using blindfold and noseplugs, administer blind taste test. Analyze results and organize data.
Fourth Grade
Life Science
Activity
Mighty Mean, Median, and Mode
Lesson Plan
Mighty Mean, Median, and Mode
Fourth Grade
Data and Graphing
Give your students a good basis in interpreting data with this lesson that teaches them about mean, median, and mode with plenty of practice and cute videos to keep them interested.
Lesson Plan
Mighty Mean, Median, and Mode
Lesson Plan
Mighty Mean, Median, and Mode
Give your students a good basis in interpreting data with this lesson that teaches them about mean, median, and mode with plenty of practice and cute videos to keep them interested.
Fourth Grade
Data and Graphing
Lesson Plan
Let's Play Ball
Lesson Plan
Let's Play Ball
Third Grade
Multiplication
Students will have a ball with this data collection lesson plan where they learn about collecting and plotting data on a chart and line plot.
Lesson Plan
Let's Play Ball
Lesson Plan
Let's Play Ball
Students will have a ball with this data collection lesson plan where they learn about collecting and plotting data on a chart and line plot.
Third Grade
Multiplication
Lesson Plan
Winter Temperatures
Worksheet
Winter Temperatures
Fourth Grade
Measurement
Your meteorologist in the making will investigate changes in temperature as she practices charting and graphing data.
Worksheet
Winter Temperatures
Worksheet
Winter Temperatures
Your meteorologist in the making will investigate changes in temperature as she practices charting and graphing data.
Fourth Grade
Measurement
Worksheet
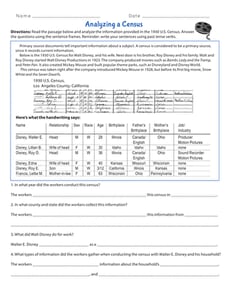
Analyzing a Census
Worksheet
Analyzing a Census
Fourth Grade
Reading
It’s census time! Travel back to 1930 to analyze the census data for the household of Walt Disney.
Worksheet
Analyzing a Census
Worksheet
Analyzing a Census
It’s census time! Travel back to 1930 to analyze the census data for the household of Walt Disney.
Fourth Grade
Reading
Worksheet
Make a Temperature Tracker
Activity
Make a Temperature Tracker
Fifth Grade
Geometry
Here's a fun at-home activity that will help your child strengthen math skills using high and low temperature data, and become a master temperature tracker!
Activity
Make a Temperature Tracker
Activity
Make a Temperature Tracker
Here's a fun at-home activity that will help your child strengthen math skills using high and low temperature data, and become a master temperature tracker!
Fifth Grade
Geometry
Activity
How Do You Measure Up?
Worksheet
How Do You Measure Up?
Fifth Grade
Fractions
Students will take practice measurements of real world objects and make a line plot of the data.
Worksheet
How Do You Measure Up?
Worksheet
How Do You Measure Up?
Students will take practice measurements of real world objects and make a line plot of the data.
Fifth Grade
Fractions
Worksheet
Reading a Timeline: Early Colonial History
Worksheet
Reading a Timeline: Early Colonial History
Third Grade
History
Give budding historians practice reading and interpreting timelines with this engaging social studies worksheet!
Worksheet
Reading a Timeline: Early Colonial History
Worksheet
Reading a Timeline: Early Colonial History
Give budding historians practice reading and interpreting timelines with this engaging social studies worksheet!
Third Grade
History
Worksheet
Interpreting a Great Poem
Worksheet
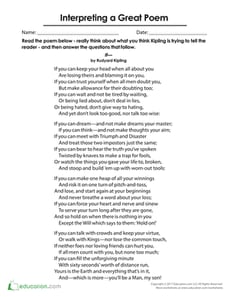
Interpreting a Great Poem
Fifth Grade
Reading
Challenge your students to consider the author's intention of a piece of writing. Ask your students to read Rudyard Kipling's poem, "If-" and answer the questions about the author's intent.
Worksheet
Interpreting a Great Poem
Worksheet
Interpreting a Great Poem
Challenge your students to consider the author's intention of a piece of writing. Ask your students to read Rudyard Kipling's poem, "If-" and answer the questions about the author's intent.
Fifth Grade
Reading
Worksheet
Probability and Statistics 2
Exercise
Probability and Statistics 2
Fourth Grade
Data and Graphing
Continue the probability and statistics fun with this involving exercise that shows students how to use data to make predictions.
Exercise
Probability and Statistics 2
Exercise
Probability and Statistics 2
Continue the probability and statistics fun with this involving exercise that shows students how to use data to make predictions.
Fourth Grade
Data and Graphing
Exercise
Peachy Line Plots
Worksheet
Peachy Line Plots
Fifth Grade
Fractions
Students create their own peachy word problems by filling in the blanks, then create a line plot with the data.
Worksheet
Peachy Line Plots
Worksheet
Peachy Line Plots
Students create their own peachy word problems by filling in the blanks, then create a line plot with the data.
Fifth Grade
Fractions
Worksheet
Foot Length: Create a Line Plot with Fractional Units
Worksheet
Foot Length: Create a Line Plot with Fractional Units
Fourth Grade
Data and Graphing
This worksheet challenges third graders to interpret the data and create a line plot with fractions, a key skill for fourth grade math.
Worksheet
Foot Length: Create a Line Plot with Fractional Units
Worksheet
Foot Length: Create a Line Plot with Fractional Units
This worksheet challenges third graders to interpret the data and create a line plot with fractions, a key skill for fourth grade math.
Fourth Grade
Data and Graphing
Worksheet
1
2
3
4
…
15