SKIP TO CONTENT
Worksheet Generator
Subjects
Grades
Worksheets
Games
Build a Worksheet
More Resources
Roly Recommends
Subjects
Grades
Worksheets
Games
Build a Worksheet
More Resources
Roly Recommends
Filters
Search for: interpret, of, as, scaling
✕
Lesson Plans
✕
3rd Grade
✕
Subjects
Math
Grade Level
Pre-K
K
1st
2nd
3rd
4th
5th
6th
7th
8th
Early Childhood
Elementary School
Middle School
Resource Type
Worksheets
Lesson Plans
Interactive Worksheets
Workbooks
Activities
Common Core
Yes
English Language Support
Yes
See More
Clear All
View 8 results
Showing Results for interpret of as scaling
8 results
Search for: interpret, of, as, scaling
✕
Lesson Plans
✕
3rd Grade
✕
Clear All
Sort by:
Relevance
Most recent
Most popular
Alphabetical A-Z
Alphabetical Z-A
All filters
8 results
Sort by:
Relevance
Most recent
Most popular
Alphabetical A-Z
Alphabetical Z-A
Let's Interpret the Line Plot
Lesson Plan
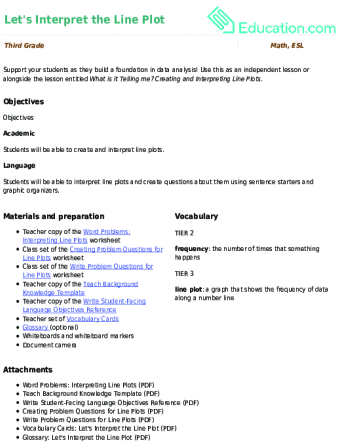
Let's Interpret the Line Plot
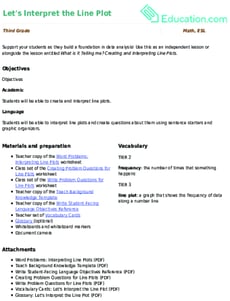
Third Grade
Support your students as they build a foundation in data analysis! Use this as an independent lesson or alongside the lesson entitled
What is it Telling me? Creating and Interpreting Line Plots.
Lesson Plan
Let's Interpret the Line Plot
Lesson Plan
Let's Interpret the Line Plot
Support your students as they build a foundation in data analysis! Use this as an independent lesson or alongside the lesson entitled
What is it Telling me? Creating and Interpreting Line Plots.
Third Grade
Lesson Plan
What is it Telling Me? Creating and Interpreting Line Plots
Lesson Plan
What is it Telling Me? Creating and Interpreting Line Plots
Third Grade
Data and Graphing
Line plots are a great way to introduce your students to graphing data. In this lesson, your students will learn how to create a line plot and also practice interpreting line plots.
Lesson Plan
What is it Telling Me? Creating and Interpreting Line Plots
Lesson Plan
What is it Telling Me? Creating and Interpreting Line Plots
Line plots are a great way to introduce your students to graphing data. In this lesson, your students will learn how to create a line plot and also practice interpreting line plots.
Third Grade
Data and Graphing
Lesson Plan
Interpreting Line Plots, Bar Graphs and Picture Graphs: Word Problems
Lesson Plan
Interpreting Line Plots, Bar Graphs and Picture Graphs: Word Problems
Third Grade
Graphs bring data to life and help us draw conclusions about the information. In this lesson, students will engage with three different kinds of graphs by asking and answering interpretive questions.
Lesson Plan
Interpreting Line Plots, Bar Graphs and Picture Graphs: Word Problems
Lesson Plan
Interpreting Line Plots, Bar Graphs and Picture Graphs: Word Problems
Graphs bring data to life and help us draw conclusions about the information. In this lesson, students will engage with three different kinds of graphs by asking and answering interpretive questions.
Third Grade
Lesson Plan
Organize Your Data
Lesson Plan
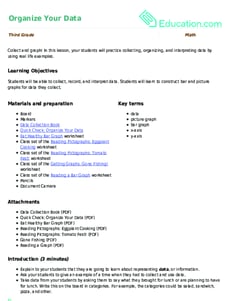
Organize Your Data
Third Grade
Collect and graph! In this lesson, your students will practice collecting, organizing, and interpreting data by using real life examples.
Lesson Plan
Organize Your Data
Lesson Plan
Organize Your Data
Collect and graph! In this lesson, your students will practice collecting, organizing, and interpreting data by using real life examples.
Third Grade
Lesson Plan
Take a Walk with Idioms
Lesson Plan
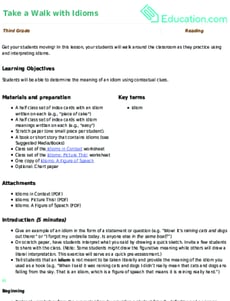
Take a Walk with Idioms
Third Grade
Get your students moving! In this lesson, your students will walk around the classroom as they practice using and interpreting idioms.
Lesson Plan
Take a Walk with Idioms
Lesson Plan
Take a Walk with Idioms
Get your students moving! In this lesson, your students will walk around the classroom as they practice using and interpreting idioms.
Third Grade
Lesson Plan
Let’s Find Out! Answering Questions by Collecting and Organizing Data
Lesson Plan
Let’s Find Out! Answering Questions by Collecting and Organizing Data
Third Grade
Your students will practice data collection and graphing while learning more about each other. Your data scientists will craft a survey question, collect data from the class, and then create a bar graph to represent their findings.
Lesson Plan
Let’s Find Out! Answering Questions by Collecting and Organizing Data
Lesson Plan
Let’s Find Out! Answering Questions by Collecting and Organizing Data
Your students will practice data collection and graphing while learning more about each other. Your data scientists will craft a survey question, collect data from the class, and then create a bar graph to represent their findings.
Third Grade
Lesson Plan
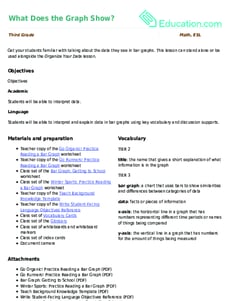
What Does the Graph Show?
Lesson Plan
What Does the Graph Show?
Third Grade
Get your students familiar with talking about the data they see in bar graphs. This lesson can stand alone or be used alongside the
Organize Your Data
lesson.
Lesson Plan
What Does the Graph Show?
Lesson Plan
What Does the Graph Show?
Get your students familiar with talking about the data they see in bar graphs. This lesson can stand alone or be used alongside the
Organize Your Data
lesson.
Third Grade
Lesson Plan
Collect, Organize, and Discuss the Data
Lesson Plan
Collect, Organize, and Discuss the Data
Third Grade
Support your students as they collect, organize, and discuss measurement data! Use this lesson independently or alongside
Making Measurements for Line Plots
.
Lesson Plan
Collect, Organize, and Discuss the Data
Lesson Plan
Collect, Organize, and Discuss the Data
Support your students as they collect, organize, and discuss measurement data! Use this lesson independently or alongside
Making Measurements for Line Plots
.
Third Grade
Lesson Plan
1