SKIP TO CONTENT
Worksheet Generator
Subjects
Grades
Worksheets
Games
Build a Worksheet
More Resources
Roly Recommends
Summer Boost
Subjects
Grades
Worksheets
Games
Build a Worksheet
More Resources
Roly Recommends
Summer Boost
Showing Results for do the decimal
Filters
Math
Data and Graphing
29 results
Search for: do, the, decimal
✕
Math
✕
3rd and 4th Grade
✕
Clear all
29 results
Subtopics:
Collecting and Organizing Data
Picture Graphs
Bar Graphs
Show Less
Filters
Search for: do, the, decimal
✕
Math
✕
3rd and 4th Grade
✕
Subjects
Math
English Language Arts
Science
Social Studies
Foreign Language
Technology
Grade Level
Pre-K
K
1st
2nd
3rd
4th
5th
6th
7th
8th
Early Childhood
Elementary School
Middle School
Resource Type
Worksheets
Games
Lesson Plans
Interactive Worksheets
Activities
Offline Games
Occasion
Birthdays
Back to School
Halloween
Holidays
Common Core
Yes
English Language Support
Yes
Clear all
View 29 results
Showing Results for do the decimal
Filters
29 results
Search for: do, the, decimal
✕
Math
✕
3rd and 4th Grade
✕
Clear all
29 results
Do We Wear the Same Colors?
Activity
Do We Wear the Same Colors?
Third Grade
Data and Graphing
Hone observational skills and introduce the basics of data interpretation with this data gathering activity all about the different colors people wear.
Activity
Do We Wear the Same Colors?
Activity
Do We Wear the Same Colors?
Hone observational skills and introduce the basics of data interpretation with this data gathering activity all about the different colors people wear.
Third Grade
Data and Graphing
Activity
Using a Chart: Do Your Chores!
Worksheet
Using a Chart: Do Your Chores!
Third Grade
Data and Graphing
Kids completing this third grade math worksheet use a chart to compare data and solve addition problems.
Worksheet
Using a Chart: Do Your Chores!
Worksheet
Using a Chart: Do Your Chores!
Kids completing this third grade math worksheet use a chart to compare data and solve addition problems.
Third Grade
Data and Graphing
Worksheet
Household Energy Consumption
Activity
Household Energy Consumption
Third Grade
Multiplication
Challenge your third-grader to sharpen her new math skills--and maybe do the planet a favor, too.
Activity
Household Energy Consumption
Activity
Household Energy Consumption
Challenge your third-grader to sharpen her new math skills--and maybe do the planet a favor, too.
Third Grade
Multiplication
Activity
Subtraction Action
Activity
Subtraction Action
Third Grade
Data and Graphing
Most parents probably wouldn't mind subtracting 8-9 years off their age. Here's a fun third grade subtraction activity that may do just that.
Activity
Subtraction Action
Activity
Subtraction Action
Most parents probably wouldn't mind subtracting 8-9 years off their age. Here's a fun third grade subtraction activity that may do just that.
Third Grade
Data and Graphing
Activity
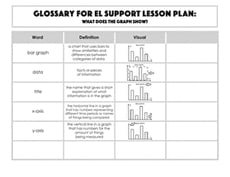
Glossary: What Does the Graph Show?
Worksheet
Glossary: What Does the Graph Show?
Third Grade
Data and Graphing
Glossary: What Does the Graph Show?
Worksheet
Glossary: What Does the Graph Show?
Worksheet
Glossary: What Does the Graph Show?
Glossary: What Does the Graph Show?
Third Grade
Data and Graphing
Worksheet
Vocabulary Cards: What Does the Graph Show?
Worksheet
Vocabulary Cards: What Does the Graph Show?
Third Grade
Data and Graphing
Use these vocabulary cards with the EL Support Lesson: What Does the Graph Show?
Worksheet
Vocabulary Cards: What Does the Graph Show?
Worksheet
Vocabulary Cards: What Does the Graph Show?
Use these vocabulary cards with the EL Support Lesson: What Does the Graph Show?
Third Grade
Data and Graphing
Worksheet
Sweet Sorting: A Fun Activity to Practice Categorizing
Activity
Sweet Sorting: A Fun Activity to Practice Categorizing
Third Grade
Data and Graphing
Delay your child's sugar overload, and develop his critical thinking skills, by doing some "sweet sorting" of his Halloween treasures!
Activity
Sweet Sorting: A Fun Activity to Practice Categorizing
Activity
Sweet Sorting: A Fun Activity to Practice Categorizing
Delay your child's sugar overload, and develop his critical thinking skills, by doing some "sweet sorting" of his Halloween treasures!
Third Grade
Data and Graphing
Activity
Pictographs: Say Cheese!
Worksheet
Pictographs: Say Cheese!
Third Grade
Data and Graphing
To keep track of his cheese sales, Giovanni uses a pictograph. Kids will figure out how his cheese business is doing by using data in the graph.
Worksheet
Pictographs: Say Cheese!
Worksheet
Pictographs: Say Cheese!
To keep track of his cheese sales, Giovanni uses a pictograph. Kids will figure out how his cheese business is doing by using data in the graph.
Third Grade
Data and Graphing
Worksheet
Reading Pictographs: Drink Your Milk!
Worksheet
Reading Pictographs: Drink Your Milk!
Third Grade
Data and Graphing
Can your child help Tommy figure out how much milk he drinks? As she does, she'll learn how to read and interpret data in graphs and practice multiplication.
Worksheet
Reading Pictographs: Drink Your Milk!
Worksheet
Reading Pictographs: Drink Your Milk!
Can your child help Tommy figure out how much milk he drinks? As she does, she'll learn how to read and interpret data in graphs and practice multiplication.
Third Grade
Data and Graphing
Worksheet
Mean, Median and Mode Madness!
Lesson Plan
Mean, Median and Mode Madness!
Third Grade
Data and Graphing
This lesson introduces students to the concepts of mean, median, and mode in a hands-on and visual way.
Lesson Plan
Mean, Median and Mode Madness!
Lesson Plan
Mean, Median and Mode Madness!
This lesson introduces students to the concepts of mean, median, and mode in a hands-on and visual way.
Third Grade
Data and Graphing
Lesson Plan
Bar Graphing with Roly
Game
Bar Graphing with Roly
Second Grade
Data and Graphing
Stop those germs! Kids must catch germs as they drop and prevent people from getting sick in this icky data and graphing game.
Game
Bar Graphing with Roly
Game
Bar Graphing with Roly
Stop those germs! Kids must catch germs as they drop and prevent people from getting sick in this icky data and graphing game.
Second Grade
Data and Graphing
Game
Interpreting Line Plots with Fractional Units
Worksheet
Interpreting Line Plots with Fractional Units
Third Grade
Data and Graphing
In this third grade worksheet, kids will interpret a line plot that includes fractional units.
Worksheet
Interpreting Line Plots with Fractional Units
Worksheet
Interpreting Line Plots with Fractional Units
In this third grade worksheet, kids will interpret a line plot that includes fractional units.
Third Grade
Data and Graphing
Worksheet
Create a Line Plot with Data Provided
Worksheet
Create a Line Plot with Data Provided
Third Grade
Data and Graphing
Use the data provided to have your students create a line plot that reflects how much TV watched per week for one third grade class.
Worksheet
Create a Line Plot with Data Provided
Worksheet
Create a Line Plot with Data Provided
Use the data provided to have your students create a line plot that reflects how much TV watched per week for one third grade class.
Third Grade
Data and Graphing
Worksheet
What Doesn't Belong? A Categorization Game
Activity
What Doesn't Belong? A Categorization Game
Third Grade
Data and Graphing
This educated-guessing game is great for preschoolers. This activity helps your child work on her reasoning skills.
Activity
What Doesn't Belong? A Categorization Game
Activity
What Doesn't Belong? A Categorization Game
This educated-guessing game is great for preschoolers. This activity helps your child work on her reasoning skills.
Third Grade
Data and Graphing
Activity
Comparing Pictographs: Taxi, Taxi
Worksheet
Comparing Pictographs: Taxi, Taxi
Third Grade
Addition
In this 3rd grade math worksheet, kids analyze and compare data in two pictographs in order to answer a set of word problems.
Worksheet
Comparing Pictographs: Taxi, Taxi
Worksheet
Comparing Pictographs: Taxi, Taxi
In this 3rd grade math worksheet, kids analyze and compare data in two pictographs in order to answer a set of word problems.
Third Grade
Addition
Worksheet
Graph Practice
Interactive Worksheet
Graph Practice
Second Grade
Data and Graphing
Don't let your second grader forget graphs! Be sure to review how to read a bar graph and pictograph with help from this handy worksheet. Challenge your young mathematician to read the graphs and answer some questions.
Interactive Worksheet
Graph Practice
Interactive Worksheet
Graph Practice
Don't let your second grader forget graphs! Be sure to review how to read a bar graph and pictograph with help from this handy worksheet. Challenge your young mathematician to read the graphs and answer some questions.
Second Grade
Data and Graphing
Interactive Worksheet
Understanding Charts: Muscleville Medals!
Worksheet
Understanding Charts: Muscleville Medals!
Third Grade
Data and Graphing
Looking for a worksheet to practice your third grader's chart reading skills? This printable works with interpreting charts.
Worksheet
Understanding Charts: Muscleville Medals!
Worksheet
Understanding Charts: Muscleville Medals!
Looking for a worksheet to practice your third grader's chart reading skills? This printable works with interpreting charts.
Third Grade
Data and Graphing
Worksheet
Bar Graph: Getting to School
Worksheet
Bar Graph: Getting to School
Third Grade
Data and Graphing
Kids completing this third grade math worksheet use a bar graph to compare data about transportation to school and solve addition and subtraction problems.
Worksheet
Bar Graph: Getting to School
Worksheet
Bar Graph: Getting to School
Kids completing this third grade math worksheet use a bar graph to compare data about transportation to school and solve addition and subtraction problems.
Third Grade
Data and Graphing
Worksheet
Comparing Pictographs: Football Time
Worksheet
Comparing Pictographs: Football Time
Third Grade
Data and Graphing
In this math worksheet, kids compare two pictographs that record the number of footballs kicked and the number of footballs thrown on the field.
Worksheet
Comparing Pictographs: Football Time
Worksheet
Comparing Pictographs: Football Time
In this math worksheet, kids compare two pictographs that record the number of footballs kicked and the number of footballs thrown on the field.
Third Grade
Data and Graphing
Worksheet
Dice Probability
Activity
Dice Probability
Fourth Grade
Data and Graphing
Analyze this simple betting game with your fourth grade student in order to discuss probability.
Activity
Dice Probability
Activity
Dice Probability
Analyze this simple betting game with your fourth grade student in order to discuss probability.
Fourth Grade
Data and Graphing
Activity
Game of Chance
Activity
Game of Chance
Third Grade
Data and Graphing
This fun math card game is a great opportunity to discuss probability with your third grader.
Activity
Game of Chance
Activity
Game of Chance
This fun math card game is a great opportunity to discuss probability with your third grader.
Third Grade
Data and Graphing
Activity
Pitch and Hit Data
Activity
Pitch and Hit Data
Third Grade
Data and Graphing
Okay, engaging in a graphing activity may sound ho-hum, but if you use fun data, it changes the picture entirely.
Activity
Pitch and Hit Data
Activity
Pitch and Hit Data
Okay, engaging in a graphing activity may sound ho-hum, but if you use fun data, it changes the picture entirely.
Third Grade
Data and Graphing
Activity
Probability Game
Activity
Probability Game
Third Grade
Data and Graphing
Probability can be a tough concept to master. Try playing this fun card game in order to help your third grader understand it a little better.
Activity
Probability Game
Activity
Probability Game
Probability can be a tough concept to master. Try playing this fun card game in order to help your third grader understand it a little better.
Third Grade
Data and Graphing
Activity
Mighty Mean, Median, and Mode
Lesson Plan
Mighty Mean, Median, and Mode
Fourth Grade
Data and Graphing
Give your students a good basis in interpreting data with this lesson that teaches them about mean, median, and mode with plenty of practice and cute videos to keep them interested.
Lesson Plan
Mighty Mean, Median, and Mode
Lesson Plan
Mighty Mean, Median, and Mode
Give your students a good basis in interpreting data with this lesson that teaches them about mean, median, and mode with plenty of practice and cute videos to keep them interested.
Fourth Grade
Data and Graphing
Lesson Plan
Track the Weather with Weather Charts
Activity
Track the Weather with Weather Charts
Third Grade
Measurement
Learn about the microclimate of your backyard by tracking rainfall, temperature, and observed weather with hand drawn charts and graphs.
Activity
Track the Weather with Weather Charts
Activity
Track the Weather with Weather Charts
Learn about the microclimate of your backyard by tracking rainfall, temperature, and observed weather with hand drawn charts and graphs.
Third Grade
Measurement
Activity
What is it Telling Me? Creating and Interpreting Line Plots
Lesson Plan
What is it Telling Me? Creating and Interpreting Line Plots
Third Grade
Data and Graphing
Line plots are a great way to introduce your students to graphing data. In this lesson, your students will learn how to create a line plot and also practice interpreting line plots.
Lesson Plan
What is it Telling Me? Creating and Interpreting Line Plots
Lesson Plan
What is it Telling Me? Creating and Interpreting Line Plots
Line plots are a great way to introduce your students to graphing data. In this lesson, your students will learn how to create a line plot and also practice interpreting line plots.
Third Grade
Data and Graphing
Lesson Plan
Create a Family Graph!
Activity
Create a Family Graph!
Third Grade
Data and Graphing
Create a graph based on the interests of family member's to see who has what in common. Your child will practice her math skills and get to know the family!
Activity
Create a Family Graph!
Activity
Create a Family Graph!
Create a graph based on the interests of family member's to see who has what in common. Your child will practice her math skills and get to know the family!
Third Grade
Data and Graphing
Activity
Draw a Birthday Bar Graph
Activity
Draw a Birthday Bar Graph
Third Grade
Data and Graphing
Liven up a lesson about graphing by helping your third grader compile a bar graph from his classmates' birthday data.
Activity
Draw a Birthday Bar Graph
Activity
Draw a Birthday Bar Graph
Liven up a lesson about graphing by helping your third grader compile a bar graph from his classmates' birthday data.
Third Grade
Data and Graphing
Activity
Study of Names
Activity
Study of Names
Third Grade
Data and Graphing
Graph are a great way to organize information. Your child will get to practice graphing by creating a bar graph and a pictorial graph of her friend's names.
Activity
Study of Names
Activity
Study of Names
Graph are a great way to organize information. Your child will get to practice graphing by creating a bar graph and a pictorial graph of her friend's names.
Third Grade
Data and Graphing
Activity
1