SKIP TO CONTENT
Worksheet Generator
Subjects
Grades
Worksheets
Games
Build a Worksheet
More Resources
Roly Recommends
Math Month
Subjects
Grades
Worksheets
Games
Build a Worksheet
More Resources
Roly Recommends
Math Month
All Subjects
Math
Subtopics:
Data and Graphing
Show Less
Filters
Search for: dive, into, data
✕
Math
✕
2nd Grade
✕
Worksheets
✕
Summer
✕
Subjects
Math
Grade Level
Pre-K
K
1st
2nd
3rd
4th
5th
6th
7th
8th
Early Childhood
Elementary School
Middle School
Resource Type
Worksheets
Occasion
Summer
Holidays
Valentine's Day
Common Core
Yes
See More
Clear All
View 11 results
Showing Results for dive into data
11 results
Search for: dive, into, data
✕
Math
✕
2nd Grade
✕
Worksheets
✕
Summer
✕
Clear All
Sort by:
Relevance
Most recent
Most popular
Alphabetical A-Z
Alphabetical Z-A
All filters
11 results
Sort by:
Relevance
Most recent
Most popular
Alphabetical A-Z
Alphabetical Z-A
Creating a Bar Graph: Favorite Picnic Spots
Worksheet
Creating a Bar Graph: Favorite Picnic Spots
Second Grade
Data and Graphing
Learners practice charting and graphing data in this hands-on worksheet.
Worksheet
Creating a Bar Graph: Favorite Picnic Spots
Worksheet
Creating a Bar Graph: Favorite Picnic Spots
Learners practice charting and graphing data in this hands-on worksheet.
Second Grade
Data and Graphing
Worksheet
Summer Hobbies Venn Diagram
Worksheet
Summer Hobbies Venn Diagram
Second Grade
Data and Graphing
Practice reading Venn diagrams with some of the most popular summertime hobbies. Your child will learn to analyze and interpret data by answering questions.
Worksheet
Summer Hobbies Venn Diagram
Worksheet
Summer Hobbies Venn Diagram
Practice reading Venn diagrams with some of the most popular summertime hobbies. Your child will learn to analyze and interpret data by answering questions.
Second Grade
Data and Graphing
Worksheet
Ocean Lake River Questions
Worksheet
Ocean Lake River Questions
Second Grade
Data and Graphing
Do you prefer rivers, oceans, or lakes? Students will practice coming up with questions by analyzing the data given in this Venn diagram.
Worksheet
Ocean Lake River Questions
Worksheet
Ocean Lake River Questions
Do you prefer rivers, oceans, or lakes? Students will practice coming up with questions by analyzing the data given in this Venn diagram.
Second Grade
Data and Graphing
Worksheet
Lemonade Stand Pictograph
Worksheet
Lemonade Stand Pictograph
Second Grade
Data and Graphing
See how Susie's lemonade stand is doing! Students will learn how to analyze and compare data by answering questions based on the two pictographs.
Worksheet
Lemonade Stand Pictograph
Worksheet
Lemonade Stand Pictograph
See how Susie's lemonade stand is doing! Students will learn how to analyze and compare data by answering questions based on the two pictographs.
Second Grade
Data and Graphing
Worksheet
Pick a Flower Pictograph
Worksheet
Pick a Flower Pictograph
Second Grade
Data and Graphing
Find out exactly how many flowers Stefanie has planted with this pictograph for kids. Your child will learn how to analyze and interpret data.
Worksheet
Pick a Flower Pictograph
Worksheet
Pick a Flower Pictograph
Find out exactly how many flowers Stefanie has planted with this pictograph for kids. Your child will learn how to analyze and interpret data.
Second Grade
Data and Graphing
Worksheet
In the Band Pie Graph
Worksheet
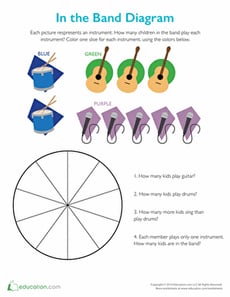
In the Band Pie Graph
Second Grade
Data and Graphing
Rock out with this pie chart! Enjoy learning how to make a pie graph and interpret data while answering questions based on the information given.
Worksheet
In the Band Pie Graph
Worksheet
In the Band Pie Graph
Rock out with this pie chart! Enjoy learning how to make a pie graph and interpret data while answering questions based on the information given.
Second Grade
Data and Graphing
Worksheet
How to Make a Bar Graph with BBQ Food
Worksheet
How to Make a Bar Graph with BBQ Food
Second Grade
Data and Graphing
Great food never goes out of style. Find out what the most popular barbecue foods are with this bar graph that teaches kids how to interpret data.
Worksheet
How to Make a Bar Graph with BBQ Food
Worksheet
How to Make a Bar Graph with BBQ Food
Great food never goes out of style. Find out what the most popular barbecue foods are with this bar graph that teaches kids how to interpret data.
Second Grade
Data and Graphing
Worksheet
Picnic Bar Graph
Worksheet
Picnic Bar Graph
Second Grade
Data and Graphing
Which picnic games do you prefer? This bar graph shows some of the most popular picnic activities. Students will learn about analyzing data from a bar graph.
Worksheet
Picnic Bar Graph
Worksheet
Picnic Bar Graph
Which picnic games do you prefer? This bar graph shows some of the most popular picnic activities. Students will learn about analyzing data from a bar graph.
Second Grade
Data and Graphing
Worksheet
Cold Drinks Bar Graph
Worksheet
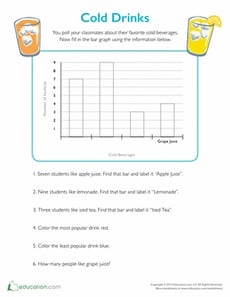
Cold Drinks Bar Graph
Second Grade
Data and Graphing
Use an easy bar graph to find out what your classmates' favorite cold drinks are. Kids will get the chance to analyze data and color in the bar graph.
Worksheet
Cold Drinks Bar Graph
Worksheet
Cold Drinks Bar Graph
Use an easy bar graph to find out what your classmates' favorite cold drinks are. Kids will get the chance to analyze data and color in the bar graph.
Second Grade
Data and Graphing
Worksheet
Hiking Buddies Pictograph
Worksheet
Hiking Buddies Pictograph
Second Grade
Data and Graphing
This pictograph shows how many hikes Eric and his friends went on this month. Use the information to answer questions and determine who hiked the most.
Worksheet
Hiking Buddies Pictograph
Worksheet
Hiking Buddies Pictograph
This pictograph shows how many hikes Eric and his friends went on this month. Use the information to answer questions and determine who hiked the most.
Second Grade
Data and Graphing
Worksheet
Ice Cream Bar Graph
Worksheet
Ice Cream Bar Graph
Second Grade
Data and Graphing
I scream for strawberry, you scream for chocolate. Either way, we all scream for ice cream! Practice asking questions with this bar graph.
Worksheet
Ice Cream Bar Graph
Worksheet
Ice Cream Bar Graph
I scream for strawberry, you scream for chocolate. Either way, we all scream for ice cream! Practice asking questions with this bar graph.
Second Grade
Data and Graphing
Worksheet
1