SKIP TO CONTENT
Worksheet Generator
Subjects
Grades
Worksheets
Games
Build a Worksheet
More Resources
Roly Recommends
Subjects
Grades
Worksheets
Games
Build a Worksheet
More Resources
Roly Recommends
All Subjects
Math
Data and Graphing
Subtopics:
Collecting and Organizing Data
Picture Graphs
Bar Graphs
Line Plots
Coordinate Plane
Show Less
Filters
Search for: word, meaning, 2
✕
Math
✕
2nd - 5th Grade
✕
Subjects
Math
English Language Arts
Science
Social Studies
Foreign Language
Grade Level
Pre-K
K
1st
2nd
3rd
4th
5th
6th
7th
8th
Early Childhood
Elementary School
Middle School
Resource Type
Worksheets
Games
Lesson Plans
Interactive Worksheets
Activities
Exercises
Offline Games
Guided Lessons
Teacher Resources
Occasion
Birthdays
St. Patrick's Day
Summer
Independence Day
Back to School
Halloween
Holidays
Common Core
Yes
English Language Support
Yes
See More
Clear All
View 74 results
Showing Results for word meaning 2 : Page 2
74 results
Search for: word, meaning, 2
✕
Math
✕
2nd - 5th Grade
✕
Clear All
Sort by:
Relevance
Most recent
Most popular
Alphabetical A-Z
Alphabetical Z-A
All filters
74 results
Sort by:
Relevance
Most recent
Most popular
Alphabetical A-Z
Alphabetical Z-A
Mighty Mean, Median, and Mode
Lesson Plan
Mighty Mean, Median, and Mode
Fourth Grade
Data and Graphing
Give your students a good basis in interpreting data with this lesson that teaches them about mean, median, and mode with plenty of practice and cute videos to keep them interested.
Lesson Plan
Mighty Mean, Median, and Mode
Lesson Plan
Mighty Mean, Median, and Mode
Give your students a good basis in interpreting data with this lesson that teaches them about mean, median, and mode with plenty of practice and cute videos to keep them interested.
Fourth Grade
Data and Graphing
Lesson Plan
Let's Graph Our Fall Favorites!
Lesson Plan
Let's Graph Our Fall Favorites!
Second Grade
Data and Graphing
This engaging math lesson combines all of your kid's fall favorites as they learn to represent data using a bar graph.
Lesson Plan
Let's Graph Our Fall Favorites!
Lesson Plan
Let's Graph Our Fall Favorites!
This engaging math lesson combines all of your kid's fall favorites as they learn to represent data using a bar graph.
Second Grade
Data and Graphing
Lesson Plan
Reading Pictographs: Going to the Theater
Worksheet
Reading Pictographs: Going to the Theater
Third Grade
Data and Graphing
In this 3rd grade math worksheet, kids practice interpreting graph data as they use the information in a pictograph to answer a set of questions.
Worksheet
Reading Pictographs: Going to the Theater
Worksheet
Reading Pictographs: Going to the Theater
In this 3rd grade math worksheet, kids practice interpreting graph data as they use the information in a pictograph to answer a set of questions.
Third Grade
Data and Graphing
Worksheet
Mean, Median and Mode Madness!
Lesson Plan
Mean, Median and Mode Madness!
Third Grade
Data and Graphing
This lesson introduces students to the concepts of mean, median, and mode in a hands-on and visual way.
Lesson Plan
Mean, Median and Mode Madness!
Lesson Plan
Mean, Median and Mode Madness!
This lesson introduces students to the concepts of mean, median, and mode in a hands-on and visual way.
Third Grade
Data and Graphing
Lesson Plan
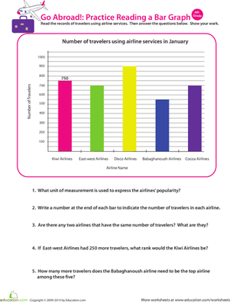
Going Abroad: Practice Reading a Bar Graph
Worksheet
Going Abroad: Practice Reading a Bar Graph
Fourth Grade
Data and Graphing
This 4th grade math worksheet will challenge your child's analytical thinking skills. He'll read a bar graph, then use its data to answer a set of questions.
Worksheet
Going Abroad: Practice Reading a Bar Graph
Worksheet
Going Abroad: Practice Reading a Bar Graph
This 4th grade math worksheet will challenge your child's analytical thinking skills. He'll read a bar graph, then use its data to answer a set of questions.
Fourth Grade
Data and Graphing
Worksheet
Probability Dice Game
Activity
Probability Dice Game
Fifth Grade
Data and Graphing
Check out this dice game perfect for teaching your savvy kid the fundamentals of probability.
Activity
Probability Dice Game
Activity
Probability Dice Game
Check out this dice game perfect for teaching your savvy kid the fundamentals of probability.
Fifth Grade
Data and Graphing
Activity
Reading Pictographs: Tomato Fest!
Worksheet
Reading Pictographs: Tomato Fest!
Third Grade
Data and Graphing
The farmers are busy picking tomatoes! Kids practice reading a pictograph to help Mr. Farmer figure out how many tomatoes he picked in this worksheet.
Worksheet
Reading Pictographs: Tomato Fest!
Worksheet
Reading Pictographs: Tomato Fest!
The farmers are busy picking tomatoes! Kids practice reading a pictograph to help Mr. Farmer figure out how many tomatoes he picked in this worksheet.
Third Grade
Data and Graphing
Worksheet
Lucky Leprechauns!
Activity
Lucky Leprechauns!
Fifth Grade
Data and Graphing
Explore the math concept of probability with your fifth grader on "lucky" St. Patrick's day this year!
Activity
Lucky Leprechauns!
Activity
Lucky Leprechauns!
Explore the math concept of probability with your fifth grader on "lucky" St. Patrick's day this year!
Fifth Grade
Data and Graphing
Activity
Go Runners! Practice Reading a Bar Graph
Worksheet
Go Runners! Practice Reading a Bar Graph
Third Grade
Data and Graphing
Your child will practice reading and interpreting a bar graph and using its data to answer a set of questions in this 3rd grade math worksheet.
Worksheet
Go Runners! Practice Reading a Bar Graph
Worksheet
Go Runners! Practice Reading a Bar Graph
Your child will practice reading and interpreting a bar graph and using its data to answer a set of questions in this 3rd grade math worksheet.
Third Grade
Data and Graphing
Worksheet
Juice Time: Practice Reading a Bar Graph
Worksheet
Juice Time: Practice Reading a Bar Graph
Third Grade
Data and Graphing
In this 3rd grade math worksheet, your child will practice reading a bar graph about juice and interpreting its information to answer a set of questions.
Worksheet
Juice Time: Practice Reading a Bar Graph
Worksheet
Juice Time: Practice Reading a Bar Graph
In this 3rd grade math worksheet, your child will practice reading a bar graph about juice and interpreting its information to answer a set of questions.
Third Grade
Data and Graphing
Worksheet
Dice Probability
Activity
Dice Probability
Fourth Grade
Data and Graphing
Analyze this simple betting game with your fourth grade student in order to discuss probability.
Activity
Dice Probability
Activity
Dice Probability
Analyze this simple betting game with your fourth grade student in order to discuss probability.
Fourth Grade
Data and Graphing
Activity
Reading Pictographs: Drink Your Milk!
Worksheet
Reading Pictographs: Drink Your Milk!
Third Grade
Data and Graphing
Can your child help Tommy figure out how much milk he drinks? As she does, she'll learn how to read and interpret data in graphs and practice multiplication.
Worksheet
Reading Pictographs: Drink Your Milk!
Worksheet
Reading Pictographs: Drink Your Milk!
Can your child help Tommy figure out how much milk he drinks? As she does, she'll learn how to read and interpret data in graphs and practice multiplication.
Third Grade
Data and Graphing
Worksheet
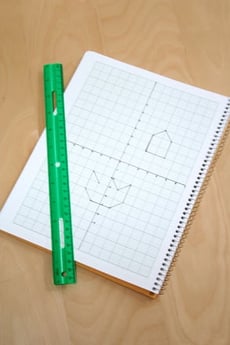
Solve a Graph Puzzle
Activity
Solve a Graph Puzzle
Fifth Grade
Data and Graphing
Here's a fun, geometric puzzle activity that will capture your child's interest and strengthen his number awareness and graphing skills.
Activity
Solve a Graph Puzzle
Activity
Solve a Graph Puzzle
Here's a fun, geometric puzzle activity that will capture your child's interest and strengthen his number awareness and graphing skills.
Fifth Grade
Data and Graphing
Activity
Olympic Math: Mean, Median and Mode Review
Lesson Plan
Olympic Math: Mean, Median and Mode Review
Fifth Grade
Data and Graphing
Help your students win gold with this lesson that gives them plenty of practice with mode, median, and mean.
Lesson Plan
Olympic Math: Mean, Median and Mode Review
Lesson Plan
Olympic Math: Mean, Median and Mode Review
Help your students win gold with this lesson that gives them plenty of practice with mode, median, and mean.
Fifth Grade
Data and Graphing
Lesson Plan
Pictograph Practice: Hamburger Cafe
Worksheet
Pictograph Practice: Hamburger Cafe
Second Grade
Data and Graphing
Pictographs are a great introduction to working with data and graphs. Kids help the hamburger cafe compare the number of hamburgers they sold using pictographs.
Worksheet
Pictograph Practice: Hamburger Cafe
Worksheet
Pictograph Practice: Hamburger Cafe
Pictographs are a great introduction to working with data and graphs. Kids help the hamburger cafe compare the number of hamburgers they sold using pictographs.
Second Grade
Data and Graphing
Worksheet
Create a Line Plot with Data Provided
Worksheet
Create a Line Plot with Data Provided
Third Grade
Data and Graphing
Use the data provided to have your students create a line plot that reflects how much TV watched per week for one third grade class.
Worksheet
Create a Line Plot with Data Provided
Worksheet
Create a Line Plot with Data Provided
Use the data provided to have your students create a line plot that reflects how much TV watched per week for one third grade class.
Third Grade
Data and Graphing
Worksheet
Interpreting Double Bar Graphs
Worksheet
Interpreting Double Bar Graphs
Fifth Grade
Data and Graphing
Students will cultivate the skills of reading, interpreting, and analyzing bar graphs with these questions that activate higher order thinking.
Worksheet
Interpreting Double Bar Graphs
Worksheet
Interpreting Double Bar Graphs
Students will cultivate the skills of reading, interpreting, and analyzing bar graphs with these questions that activate higher order thinking.
Fifth Grade
Data and Graphing
Worksheet
Subtraction Action
Activity
Subtraction Action
Third Grade
Data and Graphing
Most parents probably wouldn't mind subtracting 8-9 years off their age. Here's a fun third grade subtraction activity that may do just that.
Activity
Subtraction Action
Activity
Subtraction Action
Most parents probably wouldn't mind subtracting 8-9 years off their age. Here's a fun third grade subtraction activity that may do just that.
Third Grade
Data and Graphing
Activity
Find the Lost Redcoat
Activity
Find the Lost Redcoat
Fifth Grade
Geometry
Practice math and social studies skills with this fun game based on the Battle of Lexington and Concord.
Activity
Find the Lost Redcoat
Activity
Find the Lost Redcoat
Practice math and social studies skills with this fun game based on the Battle of Lexington and Concord.
Fifth Grade
Geometry
Activity
Do We Wear the Same Colors?
Activity
Do We Wear the Same Colors?
Third Grade
Data and Graphing
Hone observational skills and introduce the basics of data interpretation with this data gathering activity all about the different colors people wear.
Activity
Do We Wear the Same Colors?
Activity
Do We Wear the Same Colors?
Hone observational skills and introduce the basics of data interpretation with this data gathering activity all about the different colors people wear.
Third Grade
Data and Graphing
Activity
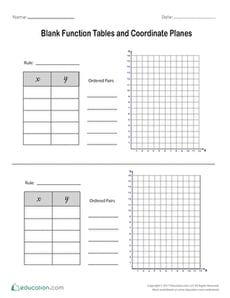
Blank Function Tables and Coordinate Planes
Worksheet
Blank Function Tables and Coordinate Planes
Fifth Grade
Geometry
Ask your students to use these blank function tables and coordinate planes to practice plotting ordered pairs.
Worksheet
Blank Function Tables and Coordinate Planes
Worksheet
Blank Function Tables and Coordinate Planes
Ask your students to use these blank function tables and coordinate planes to practice plotting ordered pairs.
Fifth Grade
Geometry
Worksheet
Pictographs: Say Cheese!
Worksheet
Pictographs: Say Cheese!
Third Grade
Data and Graphing
To keep track of his cheese sales, Giovanni uses a pictograph. Kids will figure out how his cheese business is doing by using data in the graph.
Worksheet
Pictographs: Say Cheese!
Worksheet
Pictographs: Say Cheese!
To keep track of his cheese sales, Giovanni uses a pictograph. Kids will figure out how his cheese business is doing by using data in the graph.
Third Grade
Data and Graphing
Worksheet
Winter Sports: Practice Reading a Bar Graph
Worksheet
Winter Sports: Practice Reading a Bar Graph
Second Grade
Data and Graphing
Children will practice interpreting a bar graph in this winter sports–themed math worksheet.
Worksheet
Winter Sports: Practice Reading a Bar Graph
Worksheet
Winter Sports: Practice Reading a Bar Graph
Children will practice interpreting a bar graph in this winter sports–themed math worksheet.
Second Grade
Data and Graphing
Worksheet
Using a Chart: Do Your Chores!
Worksheet
Using a Chart: Do Your Chores!
Third Grade
Data and Graphing
Kids completing this third grade math worksheet use a chart to compare data and solve addition problems.
Worksheet
Using a Chart: Do Your Chores!
Worksheet
Using a Chart: Do Your Chores!
Kids completing this third grade math worksheet use a chart to compare data and solve addition problems.
Third Grade
Data and Graphing
Worksheet
Bar Graph: Getting to School
Worksheet
Bar Graph: Getting to School
Third Grade
Data and Graphing
Kids completing this third grade math worksheet use a bar graph to compare data about transportation to school and solve addition and subtraction problems.
Worksheet
Bar Graph: Getting to School
Worksheet
Bar Graph: Getting to School
Kids completing this third grade math worksheet use a bar graph to compare data about transportation to school and solve addition and subtraction problems.
Third Grade
Data and Graphing
Worksheet
Draw a Birthday Bar Graph
Activity
Draw a Birthday Bar Graph
Third Grade
Data and Graphing
Liven up a lesson about graphing by helping your third grader compile a bar graph from his classmates' birthday data.
Activity
Draw a Birthday Bar Graph
Activity
Draw a Birthday Bar Graph
Liven up a lesson about graphing by helping your third grader compile a bar graph from his classmates' birthday data.
Third Grade
Data and Graphing
Activity
What is it Telling Me? Creating and Interpreting Line Plots
Lesson Plan
What is it Telling Me? Creating and Interpreting Line Plots
Third Grade
Data and Graphing
Line plots are a great way to introduce your students to graphing data. In this lesson, your students will learn how to create a line plot and also practice interpreting line plots.
Lesson Plan
What is it Telling Me? Creating and Interpreting Line Plots
Lesson Plan
What is it Telling Me? Creating and Interpreting Line Plots
Line plots are a great way to introduce your students to graphing data. In this lesson, your students will learn how to create a line plot and also practice interpreting line plots.
Third Grade
Data and Graphing
Lesson Plan
The Mean, Median, and Mode Card Game
Activity
The Mean, Median, and Mode Card Game
Fifth Grade
Data and Graphing
Want to ensure that your child's math knowledge stays sharp? This mean, median, and mode game is the perfect way to reinforce these essential math concepts.
Activity
The Mean, Median, and Mode Card Game
Activity
The Mean, Median, and Mode Card Game
Want to ensure that your child's math knowledge stays sharp? This mean, median, and mode game is the perfect way to reinforce these essential math concepts.
Fifth Grade
Data and Graphing
Activity
Practice Reading Venn Diagrams #3: Favorite Dessert
Worksheet
Practice Reading Venn Diagrams #3: Favorite Dessert
Second Grade
Data and Graphing
Kids practice reading a Venn diagram about favorite desserts and answer questions about it in this 2nd grade math worksheet.
Worksheet
Practice Reading Venn Diagrams #3: Favorite Dessert
Worksheet
Practice Reading Venn Diagrams #3: Favorite Dessert
Kids practice reading a Venn diagram about favorite desserts and answer questions about it in this 2nd grade math worksheet.
Second Grade
Data and Graphing
Worksheet
Creating a Bar Graph: Favorite Picnic Spots
Worksheet
Creating a Bar Graph: Favorite Picnic Spots
Second Grade
Data and Graphing
Learners practice charting and graphing data in this hands-on worksheet.
Worksheet
Creating a Bar Graph: Favorite Picnic Spots
Worksheet
Creating a Bar Graph: Favorite Picnic Spots
Learners practice charting and graphing data in this hands-on worksheet.
Second Grade
Data and Graphing
Worksheet
1
2
3