SKIP TO CONTENT
Worksheet Generator
Subjects
Grades
Worksheets
Games
Build a Worksheet
More Resources
Roly Recommends
Subjects
Grades
Worksheets
Games
Build a Worksheet
More Resources
Roly Recommends
All Subjects
Math
Data and Graphing
Subtopics:
Collecting and Organizing Data
Picture Graphs
Bar Graphs
Line Plots
Coordinate Plane
Show Less
Filters
Search for: how, when
✕
Math
✕
2nd - 5th Grade
✕
Subjects
Math
English Language Arts
Science
Social Studies
Foreign Language
Grade Level
Pre-K
K
1st
2nd
3rd
4th
5th
6th
7th
8th
Early Childhood
Elementary School
Middle School
Resource Type
Worksheets
Games
Lesson Plans
Interactive Worksheets
Activities
Exercises
Offline Games
Guided Lessons
Occasion
Birthdays
St. Patrick's Day
Summer
Independence Day
Back to School
Halloween
Holidays
Hanukkah
Valentine's Day
Common Core
Yes
English Language Support
Yes
See More
Clear All
View 108 results
Showing Results for how when : Page 2
108 results
Search for: how, when
✕
Math
✕
2nd - 5th Grade
✕
Clear All
Sort by:
Relevance
Most recent
Most popular
Alphabetical A-Z
Alphabetical Z-A
All filters
108 results
Sort by:
Relevance
Most recent
Most popular
Alphabetical A-Z
Alphabetical Z-A
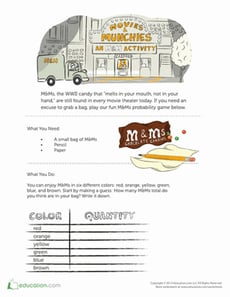
M&Ms Activity
Worksheet
M&Ms Activity
Fifth Grade
Data and Graphing
M&Ms come in six colors and lend themselves perfectly to a game of predictions and probability. Try to guess how many pieces of each color there are in a bag!
Worksheet
M&Ms Activity
Worksheet
M&Ms Activity
M&Ms come in six colors and lend themselves perfectly to a game of predictions and probability. Try to guess how many pieces of each color there are in a bag!
Fifth Grade
Data and Graphing
Worksheet
What is it Telling Me? Creating and Interpreting Line Plots
Lesson Plan
What is it Telling Me? Creating and Interpreting Line Plots
Third Grade
Data and Graphing
Line plots are a great way to introduce your students to graphing data. In this lesson, your students will learn how to create a line plot and also practice interpreting line plots.
Lesson Plan
What is it Telling Me? Creating and Interpreting Line Plots
Lesson Plan
What is it Telling Me? Creating and Interpreting Line Plots
Line plots are a great way to introduce your students to graphing data. In this lesson, your students will learn how to create a line plot and also practice interpreting line plots.
Third Grade
Data and Graphing
Lesson Plan
Graph Practice
Interactive Worksheet
Graph Practice
Second Grade
Data and Graphing
Don't let your second grader forget graphs! Be sure to review how to read a bar graph and pictograph with help from this handy worksheet. Challenge your young mathematician to read the graphs and answer some questions.
Interactive Worksheet
Graph Practice
Interactive Worksheet
Graph Practice
Don't let your second grader forget graphs! Be sure to review how to read a bar graph and pictograph with help from this handy worksheet. Challenge your young mathematician to read the graphs and answer some questions.
Second Grade
Data and Graphing
Interactive Worksheet
Data 1
Guided Lesson
Data 1
Third Grade
Fractions
Learning how to represent numerical information is a key part of the third grade math curriculum. This lesson in data provides guided instruction designed by our team of curriculum experts and teachers to present this concept in an engaging way. Not only that, but helpful exercises help kids to see the practical applicaton of these skills in the real world.
Guided Lesson
Data 1
Guided Lesson
Data 1
Learning how to represent numerical information is a key part of the third grade math curriculum. This lesson in data provides guided instruction designed by our team of curriculum experts and teachers to present this concept in an engaging way. Not only that, but helpful exercises help kids to see the practical applicaton of these skills in the real world.
Third Grade
Fractions
Guided Lesson
Subtraction Action
Activity
Subtraction Action
Third Grade
Data and Graphing
Most parents probably wouldn't mind subtracting 8-9 years off their age. Here's a fun third grade subtraction activity that may do just that.
Activity
Subtraction Action
Activity
Subtraction Action
Most parents probably wouldn't mind subtracting 8-9 years off their age. Here's a fun third grade subtraction activity that may do just that.
Third Grade
Data and Graphing
Activity
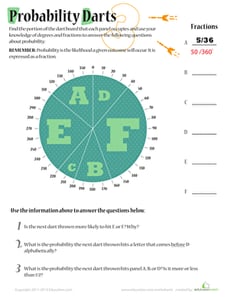
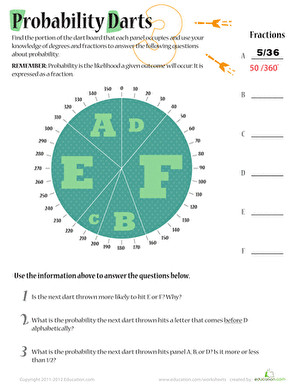
Probability Darts 3
Worksheet
Probability Darts 3
Fifth Grade
Data and Graphing
Build on fraction math skills and work with degrees to get probability practice for your middle schooler with this math worksheet series.
Worksheet
Probability Darts 3
Worksheet
Probability Darts 3
Build on fraction math skills and work with degrees to get probability practice for your middle schooler with this math worksheet series.
Fifth Grade
Data and Graphing
Worksheet
Game of Chance
Activity
Game of Chance
Third Grade
Data and Graphing
This fun math card game is a great opportunity to discuss probability with your third grader.
Activity
Game of Chance
Activity
Game of Chance
This fun math card game is a great opportunity to discuss probability with your third grader.
Third Grade
Data and Graphing
Activity
What Doesn't Belong? A Categorization Game
Activity
What Doesn't Belong? A Categorization Game
Third Grade
Data and Graphing
This educated-guessing game is great for preschoolers. This activity helps your child work on her reasoning skills.
Activity
What Doesn't Belong? A Categorization Game
Activity
What Doesn't Belong? A Categorization Game
This educated-guessing game is great for preschoolers. This activity helps your child work on her reasoning skills.
Third Grade
Data and Graphing
Activity
Summer Bar Graph
Activity
Summer Bar Graph
First Grade
Data and Graphing
Draw some educational value out of a summer stocked full of adventures!
Activity
Summer Bar Graph
Activity
Summer Bar Graph
Draw some educational value out of a summer stocked full of adventures!
First Grade
Data and Graphing
Activity
Draw a Birthday Bar Graph
Activity
Draw a Birthday Bar Graph
Third Grade
Data and Graphing
Liven up a lesson about graphing by helping your third grader compile a bar graph from his classmates' birthday data.
Activity
Draw a Birthday Bar Graph
Activity
Draw a Birthday Bar Graph
Liven up a lesson about graphing by helping your third grader compile a bar graph from his classmates' birthday data.
Third Grade
Data and Graphing
Activity
Mystery Picture Graph: All Hallow's Eve
Worksheet
Mystery Picture Graph: All Hallow's Eve
Fifth Grade
Geometry
The coordinate plane just got a little spookier! Can you graph these coordinates to reveal the hidden picture?
Worksheet
Mystery Picture Graph: All Hallow's Eve
Worksheet
Mystery Picture Graph: All Hallow's Eve
The coordinate plane just got a little spookier! Can you graph these coordinates to reveal the hidden picture?
Fifth Grade
Geometry
Worksheet
Mystery Picture Graph: Night Scene
Worksheet
Mystery Picture Graph: Night Scene
Fifth Grade
Geometry
Plot the coordinates on the grid to reveal a mystery picture in this two-page graphing worksheet!
Worksheet
Mystery Picture Graph: Night Scene
Worksheet
Mystery Picture Graph: Night Scene
Plot the coordinates on the grid to reveal a mystery picture in this two-page graphing worksheet!
Fifth Grade
Geometry
Worksheet
Sweet Sorting: A Fun Activity to Practice Categorizing
Activity
Sweet Sorting: A Fun Activity to Practice Categorizing
Third Grade
Data and Graphing
Delay your child's sugar overload, and develop his critical thinking skills, by doing some "sweet sorting" of his Halloween treasures!
Activity
Sweet Sorting: A Fun Activity to Practice Categorizing
Activity
Sweet Sorting: A Fun Activity to Practice Categorizing
Delay your child's sugar overload, and develop his critical thinking skills, by doing some "sweet sorting" of his Halloween treasures!
Third Grade
Data and Graphing
Activity
Bar Graphing with Roly
Game
Bar Graphing with Roly
Second Grade
Data and Graphing
Stop those germs! Kids must catch germs as they drop and prevent people from getting sick in this icky data and graphing game.
Game
Bar Graphing with Roly
Game
Bar Graphing with Roly
Stop those germs! Kids must catch germs as they drop and prevent people from getting sick in this icky data and graphing game.
Second Grade
Data and Graphing
Game
Bar Graph: Getting to School
Worksheet
Bar Graph: Getting to School
Third Grade
Data and Graphing
Kids completing this third grade math worksheet use a bar graph to compare data about transportation to school and solve addition and subtraction problems.
Worksheet
Bar Graph: Getting to School
Worksheet
Bar Graph: Getting to School
Kids completing this third grade math worksheet use a bar graph to compare data about transportation to school and solve addition and subtraction problems.
Third Grade
Data and Graphing
Worksheet
Probability Dice Game
Activity
Probability Dice Game
Fifth Grade
Data and Graphing
Check out this dice game perfect for teaching your savvy kid the fundamentals of probability.
Activity
Probability Dice Game
Activity
Probability Dice Game
Check out this dice game perfect for teaching your savvy kid the fundamentals of probability.
Fifth Grade
Data and Graphing
Activity
Olympic Math: Mean, Median and Mode Review
Lesson Plan
Olympic Math: Mean, Median and Mode Review
Fifth Grade
Data and Graphing
Help your students win gold with this lesson that gives them plenty of practice with mode, median, and mean.
Lesson Plan
Olympic Math: Mean, Median and Mode Review
Lesson Plan
Olympic Math: Mean, Median and Mode Review
Help your students win gold with this lesson that gives them plenty of practice with mode, median, and mean.
Fifth Grade
Data and Graphing
Lesson Plan
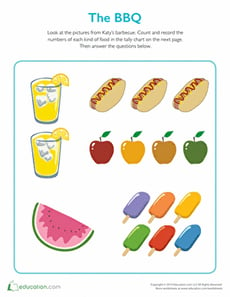
The BBQ Tally
Worksheet
The BBQ Tally
Second Grade
Data and Graphing
Your student will use the colorful pictures to count the number of food items that were consumed and record the information using the tally chart provided.
Worksheet
The BBQ Tally
Worksheet
The BBQ Tally
Your student will use the colorful pictures to count the number of food items that were consumed and record the information using the tally chart provided.
Second Grade
Data and Graphing
Worksheet
Reading Pictographs: Building a New Town
Worksheet
Reading Pictographs: Building a New Town
Third Grade
Data and Graphing
In this 3rd grade math worksheet, kids practice interpreting graph data and using information in a pictograph to answer word problems.
Worksheet
Reading Pictographs: Building a New Town
Worksheet
Reading Pictographs: Building a New Town
In this 3rd grade math worksheet, kids practice interpreting graph data and using information in a pictograph to answer word problems.
Third Grade
Data and Graphing
Worksheet
Make a Temperature Tracker
Activity
Make a Temperature Tracker
Fifth Grade
Geometry
Here's a fun at-home activity that will help your child strengthen math skills using high and low temperature data, and become a master temperature tracker!
Activity
Make a Temperature Tracker
Activity
Make a Temperature Tracker
Here's a fun at-home activity that will help your child strengthen math skills using high and low temperature data, and become a master temperature tracker!
Fifth Grade
Geometry
Activity
Interpreting Double Bar Graphs
Worksheet
Interpreting Double Bar Graphs
Fifth Grade
Data and Graphing
Students will cultivate the skills of reading, interpreting, and analyzing bar graphs with these questions that activate higher order thinking.
Worksheet
Interpreting Double Bar Graphs
Worksheet
Interpreting Double Bar Graphs
Students will cultivate the skills of reading, interpreting, and analyzing bar graphs with these questions that activate higher order thinking.
Fifth Grade
Data and Graphing
Worksheet
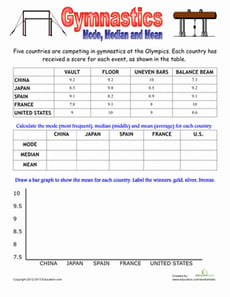
Olympic Math: Gymnastics
Worksheet
Olympic Math: Gymnastics
Fifth Grade
Data and Graphing
Flip your way to finding the mean, median and mode of these Olympic scores! Practice basic data analysis, and then put the information in a bar graph.
Worksheet
Olympic Math: Gymnastics
Worksheet
Olympic Math: Gymnastics
Flip your way to finding the mean, median and mode of these Olympic scores! Practice basic data analysis, and then put the information in a bar graph.
Fifth Grade
Data and Graphing
Worksheet
Mean, Median and Mode Madness!
Lesson Plan
Mean, Median and Mode Madness!
Third Grade
Data and Graphing
This lesson introduces students to the concepts of mean, median, and mode in a hands-on and visual way.
Lesson Plan
Mean, Median and Mode Madness!
Lesson Plan
Mean, Median and Mode Madness!
This lesson introduces students to the concepts of mean, median, and mode in a hands-on and visual way.
Third Grade
Data and Graphing
Lesson Plan
Do a Survey! Favorite Veggies
Worksheet
Do a Survey! Favorite Veggies
Second Grade
Data and Graphing
Give your second grader some practice working with data with this fun-to-complete favorite veggie survey.
Worksheet
Do a Survey! Favorite Veggies
Worksheet
Do a Survey! Favorite Veggies
Give your second grader some practice working with data with this fun-to-complete favorite veggie survey.
Second Grade
Data and Graphing
Worksheet
Bike Pictograph Questions
Worksheet
Bike Pictograph Questions
Second Grade
Data and Graphing
With these pictograph questions, your kid will hone his skills at reading and interpreting graphs.
Worksheet
Bike Pictograph Questions
Worksheet
Bike Pictograph Questions
With these pictograph questions, your kid will hone his skills at reading and interpreting graphs.
Second Grade
Data and Graphing
Worksheet
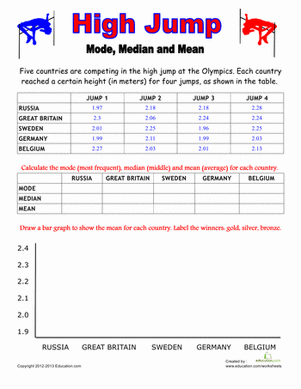
Olympic Math: High Jump
Worksheet
Olympic Math: High Jump
Fifth Grade
Data and Graphing
Jump over the hurdles of math by learning mode, median and mean. Use knowledge of data analysis to put each country's scores in a graph and award the winners!
Worksheet
Olympic Math: High Jump
Worksheet
Olympic Math: High Jump
Jump over the hurdles of math by learning mode, median and mean. Use knowledge of data analysis to put each country's scores in a graph and award the winners!
Fifth Grade
Data and Graphing
Worksheet
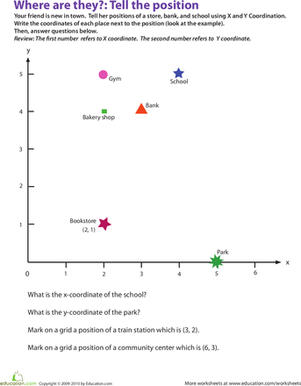
Where Are They? Find Coordinates
Worksheet
Where Are They? Find Coordinates
Fourth Grade
Data and Graphing
Give your fourth grader some practice with graphing and coordinates as she determines each location's coordinates on this printable.
Worksheet
Where Are They? Find Coordinates
Worksheet
Where Are They? Find Coordinates
Give your fourth grader some practice with graphing and coordinates as she determines each location's coordinates on this printable.
Fourth Grade
Data and Graphing
Worksheet
Reading Pictographs: Going to the Theater
Worksheet
Reading Pictographs: Going to the Theater
Third Grade
Data and Graphing
In this 3rd grade math worksheet, kids practice interpreting graph data as they use the information in a pictograph to answer a set of questions.
Worksheet
Reading Pictographs: Going to the Theater
Worksheet
Reading Pictographs: Going to the Theater
In this 3rd grade math worksheet, kids practice interpreting graph data as they use the information in a pictograph to answer a set of questions.
Third Grade
Data and Graphing
Worksheet
Practice Graphs
Worksheet
Practice Graphs
Second Grade
Data and Graphing
Kids practice representing a set of data using three kinds of graphs: a bar graph, pictograph, and pie graph.
Worksheet
Practice Graphs
Worksheet
Practice Graphs
Kids practice representing a set of data using three kinds of graphs: a bar graph, pictograph, and pie graph.
Second Grade
Data and Graphing
Worksheet
Math + Love = Valentine's Day Bar Graph
Lesson Plan
Math + Love = Valentine's Day Bar Graph
Second Grade
Data and Graphing
What's more romantic than a bar graph on Valentine's Day? In this Valentine's Day lesson plan, students will use information from a data set to create their own tally charts and bar graphs and then analyze these graphs to answer questions.
Lesson Plan
Math + Love = Valentine's Day Bar Graph
Lesson Plan
Math + Love = Valentine's Day Bar Graph
What's more romantic than a bar graph on Valentine's Day? In this Valentine's Day lesson plan, students will use information from a data set to create their own tally charts and bar graphs and then analyze these graphs to answer questions.
Second Grade
Data and Graphing
Lesson Plan
1
2
3
4