SKIP TO CONTENT
Worksheet Generator
Subjects
Grades
Worksheets
Games
Build a Worksheet
More Resources
Roly Recommends
Subjects
Grades
Worksheets
Games
Build a Worksheet
More Resources
Roly Recommends
All Subjects
Math
Data and Graphing
Subtopics:
Collecting and Organizing Data
Picture Graphs
Bar Graphs
Line Plots
Coordinate Plane
Show Less
Filters
Search for: one, digit, and, two, step, word, problems
✕
Math
✕
2nd - 4th Grade
✕
Subjects
Math
English Language Arts
Science
Social Studies
Foreign Language
Grade Level
Pre-K
K
1st
2nd
3rd
4th
5th
6th
7th
8th
Early Childhood
Elementary School
Middle School
Resource Type
Worksheets
Games
Lesson Plans
Interactive Worksheets
Activities
Exercises
Offline Games
Guided Lessons
Occasion
Birthdays
St. Patrick's Day
Summer
Back to School
Halloween
Holidays
Hanukkah
Common Core
Yes
English Language Support
Yes
See More
Clear All
View 71 results
Showing Results for one digit and two step word problems
71 results
Search for: one, digit, and, two, step, word, problems
✕
Math
✕
2nd - 4th Grade
✕
Clear All
Sort by:
Relevance
Most recent
Most popular
Alphabetical A-Z
Alphabetical Z-A
All filters
71 results
Sort by:
Relevance
Most recent
Most popular
Alphabetical A-Z
Alphabetical Z-A
Using Base 10 Drawings in Two-Digit Addition
Worksheet
Using Base 10 Drawings in Two-Digit Addition
Second Grade
Addition
This worksheet teaches you to use base 10 drawings to add two-digit numbers.
Worksheet
Using Base 10 Drawings in Two-Digit Addition
Worksheet
Using Base 10 Drawings in Two-Digit Addition
This worksheet teaches you to use base 10 drawings to add two-digit numbers.
Second Grade
Addition
Worksheet
Word Problems: Interpreting Line Plots
Worksheet
Word Problems: Interpreting Line Plots
Second Grade
Data and Graphing
Students will have a chance to practice solving word problems using line plots with this worksheet.
Worksheet
Word Problems: Interpreting Line Plots
Worksheet
Word Problems: Interpreting Line Plots
Students will have a chance to practice solving word problems using line plots with this worksheet.
Second Grade
Data and Graphing
Worksheet
Football Word Problems
Interactive Worksheet
Football Word Problems
Third Grade
Mixed Operations
Combine a love of football with math in this sports word problem worksheet! Sharpen your 3rd grader's subtraction, addition, and multiplication skills.
Interactive Worksheet
Football Word Problems
Interactive Worksheet
Football Word Problems
Combine a love of football with math in this sports word problem worksheet! Sharpen your 3rd grader's subtraction, addition, and multiplication skills.
Third Grade
Mixed Operations
Interactive Worksheet
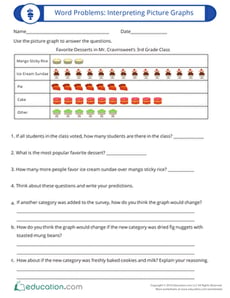
Word Problems: Interpreting Picture Graphs
Worksheet
Word Problems: Interpreting Picture Graphs
Third Grade
Data and Graphing
Students will cultivate the skills of reading, interpreting and analyzing picture graphs with this word problem that activates higher order thinking.
Worksheet
Word Problems: Interpreting Picture Graphs
Worksheet
Word Problems: Interpreting Picture Graphs
Students will cultivate the skills of reading, interpreting and analyzing picture graphs with this word problem that activates higher order thinking.
Third Grade
Data and Graphing
Worksheet
Comparing Pictographs: Taxi, Taxi
Worksheet
Comparing Pictographs: Taxi, Taxi
Third Grade
Addition
In this 3rd grade math worksheet, kids analyze and compare data in two pictographs in order to answer a set of word problems.
Worksheet
Comparing Pictographs: Taxi, Taxi
Worksheet
Comparing Pictographs: Taxi, Taxi
In this 3rd grade math worksheet, kids analyze and compare data in two pictographs in order to answer a set of word problems.
Third Grade
Addition
Worksheet
Comparing Pictographs: Tulips and Daisies
Worksheet
Comparing Pictographs: Tulips and Daisies
Second Grade
Data and Graphing
Your child will use the data in two pictographs that show the number of tulips and daisies imported from certain European countries to answer word problems.
Worksheet
Comparing Pictographs: Tulips and Daisies
Worksheet
Comparing Pictographs: Tulips and Daisies
Your child will use the data in two pictographs that show the number of tulips and daisies imported from certain European countries to answer word problems.
Second Grade
Data and Graphing
Worksheet
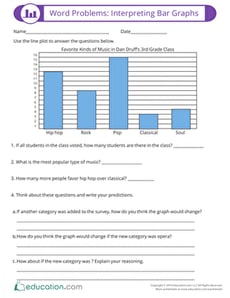
Word Problems: Interpreting Bar Graphs
Worksheet
Word Problems: Interpreting Bar Graphs
Third Grade
Data and Graphing
Worksheet
Word Problems: Interpreting Bar Graphs
Worksheet
Word Problems: Interpreting Bar Graphs
Third Grade
Data and Graphing
Worksheet
Measurement and Data 4
Guided Lesson
Measurement and Data 4
Fourth Grade
Fractions
Representing data on graphs makes math visual and involves some creativity and design. Plotting data using fractional units takes their learning one step further. Also in this unit, students learn to measure using both traditional units (like inches, feet and yards) and metric units, and how to convert measurements within each system. The concept of measurement gets two dimensional when students explore measuring and working with angles.
Guided Lesson
Measurement and Data 4
Guided Lesson
Measurement and Data 4
Representing data on graphs makes math visual and involves some creativity and design. Plotting data using fractional units takes their learning one step further. Also in this unit, students learn to measure using both traditional units (like inches, feet and yards) and metric units, and how to convert measurements within each system. The concept of measurement gets two dimensional when students explore measuring and working with angles.
Fourth Grade
Fractions
Guided Lesson
Zap and Kreb: Graphing Word Problems
Game
Zap and Kreb: Graphing Word Problems
Third Grade
Data and Graphing
Kids journey to Earth with aliens Zap and Kreb on a mission to gather data and create graphs in a math story that's out of this world!
Game
Zap and Kreb: Graphing Word Problems
Game
Zap and Kreb: Graphing Word Problems
Kids journey to Earth with aliens Zap and Kreb on a mission to gather data and create graphs in a math story that's out of this world!
Third Grade
Data and Graphing
Game
Reading Pictographs: Building a New Town
Worksheet
Reading Pictographs: Building a New Town
Third Grade
Data and Graphing
In this 3rd grade math worksheet, kids practice interpreting graph data and using information in a pictograph to answer word problems.
Worksheet
Reading Pictographs: Building a New Town
Worksheet
Reading Pictographs: Building a New Town
In this 3rd grade math worksheet, kids practice interpreting graph data and using information in a pictograph to answer word problems.
Third Grade
Data and Graphing
Worksheet
Reading Pictographs: Eggplant Cooking
Worksheet
Reading Pictographs: Eggplant Cooking
Third Grade
Data and Graphing
Mr. Chef keeps track of how many eggplants he uses with a pictograph. In this worksheet, kids use information in the pictograph to answer word problems.
Worksheet
Reading Pictographs: Eggplant Cooking
Worksheet
Reading Pictographs: Eggplant Cooking
Mr. Chef keeps track of how many eggplants he uses with a pictograph. In this worksheet, kids use information in the pictograph to answer word problems.
Third Grade
Data and Graphing
Worksheet
Reading Pictographs: Carrots for Bunnies
Worksheet
Reading Pictographs: Carrots for Bunnies
Third Grade
Data and Graphing
How many carrots did Sammy's pet bunny eat? Kids use information in the pictograph to answer word problems in this bunny-filled math worksheet.
Worksheet
Reading Pictographs: Carrots for Bunnies
Worksheet
Reading Pictographs: Carrots for Bunnies
How many carrots did Sammy's pet bunny eat? Kids use information in the pictograph to answer word problems in this bunny-filled math worksheet.
Third Grade
Data and Graphing
Worksheet
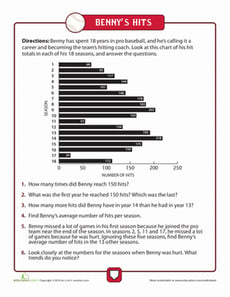
Reading Graphs
Worksheet
Reading Graphs
Third Grade
Data and Graphing
Try getting started with reading graphs with this worksheet showing a baseball player's hits throughout his career, and answer the word problems.
Worksheet
Reading Graphs
Worksheet
Reading Graphs
Try getting started with reading graphs with this worksheet showing a baseball player's hits throughout his career, and answer the word problems.
Third Grade
Data and Graphing
Worksheet
Data 1
Guided Lesson
Data 1
Third Grade
Fractions
Learning how to represent numerical information is a key part of the third grade math curriculum. This lesson in data provides guided instruction designed by our team of curriculum experts and teachers to present this concept in an engaging way. Not only that, but helpful exercises help kids to see the practical applicaton of these skills in the real world.
Guided Lesson
Data 1
Guided Lesson
Data 1
Learning how to represent numerical information is a key part of the third grade math curriculum. This lesson in data provides guided instruction designed by our team of curriculum experts and teachers to present this concept in an engaging way. Not only that, but helpful exercises help kids to see the practical applicaton of these skills in the real world.
Third Grade
Fractions
Guided Lesson
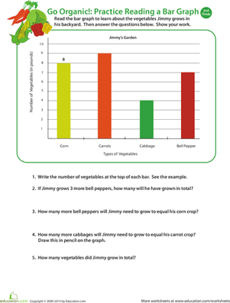
Go Organic! Practice Reading a Bar Graph
Worksheet
Go Organic! Practice Reading a Bar Graph
Second Grade
Data and Graphing
Boost your child's analytical thinking skills with this 2nd grade math worksheet in which he'll use data from a bar graph to answer word problems.
Worksheet
Go Organic! Practice Reading a Bar Graph
Worksheet
Go Organic! Practice Reading a Bar Graph
Boost your child's analytical thinking skills with this 2nd grade math worksheet in which he'll use data from a bar graph to answer word problems.
Second Grade
Data and Graphing
Worksheet
Probability Quiz
Worksheet
Probability Quiz
Fourth Grade
Data and Graphing
Here's a great opportunity for your child to practice probability! He'll solve word problems about the probability of choosing an item from a group.
Worksheet
Probability Quiz
Worksheet
Probability Quiz
Here's a great opportunity for your child to practice probability! He'll solve word problems about the probability of choosing an item from a group.
Fourth Grade
Data and Graphing
Worksheet
Measurement and Graphing 1
Exercise
Measurement and Graphing 1
Third Grade
Fractions
This exercise will introduce students to the concept of taking measurements and graphing the data.
Exercise
Measurement and Graphing 1
Exercise
Measurement and Graphing 1
This exercise will introduce students to the concept of taking measurements and graphing the data.
Third Grade
Fractions
Exercise
Probability and Statistics 1
Exercise
Probability and Statistics 1
Third Grade
Data and Graphing
This engaging exercise will introduce students to probability and statistics in a way that excites them to continue learning.
Exercise
Probability and Statistics 1
Exercise
Probability and Statistics 1
This engaging exercise will introduce students to probability and statistics in a way that excites them to continue learning.
Third Grade
Data and Graphing
Exercise
Comparing Pictographs: Football Time
Worksheet
Comparing Pictographs: Football Time
Third Grade
Data and Graphing
In this math worksheet, kids compare two pictographs that record the number of footballs kicked and the number of footballs thrown on the field.
Worksheet
Comparing Pictographs: Football Time
Worksheet
Comparing Pictographs: Football Time
In this math worksheet, kids compare two pictographs that record the number of footballs kicked and the number of footballs thrown on the field.
Third Grade
Data and Graphing
Worksheet
Probability and Statistics 2
Exercise
Probability and Statistics 2
Fourth Grade
Data and Graphing
Continue the probability and statistics fun with this involving exercise that shows students how to use data to make predictions.
Exercise
Probability and Statistics 2
Exercise
Probability and Statistics 2
Continue the probability and statistics fun with this involving exercise that shows students how to use data to make predictions.
Fourth Grade
Data and Graphing
Exercise
Collecting and Organizing Data 1
Exercise
Collecting and Organizing Data 1
Third Grade
Data and Graphing
Students will learn how to collect and organize data thanks to this interesting exercise from Education.com.
Exercise
Collecting and Organizing Data 1
Exercise
Collecting and Organizing Data 1
Students will learn how to collect and organize data thanks to this interesting exercise from Education.com.
Third Grade
Data and Graphing
Exercise
Collecting and Organizing Data 2
Exercise
Collecting and Organizing Data 2
Fourth Grade
Data and Graphing
Your students will grow adept at collecting and organizing data around them with this engaging exercise.
Exercise
Collecting and Organizing Data 2
Exercise
Collecting and Organizing Data 2
Your students will grow adept at collecting and organizing data around them with this engaging exercise.
Fourth Grade
Data and Graphing
Exercise
Practice Reading Venn Diagrams #1: Favorite Hobby
Worksheet
Practice Reading Venn Diagrams #1: Favorite Hobby
Second Grade
Data and Graphing
Kids practice reading a Venn diagram about favorite hobbies and answer questions about it in this 2nd grade math worksheet.
Worksheet
Practice Reading Venn Diagrams #1: Favorite Hobby
Worksheet
Practice Reading Venn Diagrams #1: Favorite Hobby
Kids practice reading a Venn diagram about favorite hobbies and answer questions about it in this 2nd grade math worksheet.
Second Grade
Data and Graphing
Worksheet
Practice Reading Venn Diagrams #2: In the Orchestra
Worksheet
Practice Reading Venn Diagrams #2: In the Orchestra
Second Grade
Data and Graphing
Kids practice reading a Venn diagram about instruments in an orchestra and answering questions about it in this 2nd grade math worksheet.
Worksheet
Practice Reading Venn Diagrams #2: In the Orchestra
Worksheet
Practice Reading Venn Diagrams #2: In the Orchestra
Kids practice reading a Venn diagram about instruments in an orchestra and answering questions about it in this 2nd grade math worksheet.
Second Grade
Data and Graphing
Worksheet
Lemonade Stand Pictograph
Worksheet
Lemonade Stand Pictograph
Second Grade
Data and Graphing
See how Susie's lemonade stand is doing! Students will learn how to analyze and compare data by answering questions based on the two pictographs.
Worksheet
Lemonade Stand Pictograph
Worksheet
Lemonade Stand Pictograph
See how Susie's lemonade stand is doing! Students will learn how to analyze and compare data by answering questions based on the two pictographs.
Second Grade
Data and Graphing
Worksheet
Using a Chart: Do Your Chores!
Worksheet
Using a Chart: Do Your Chores!
Third Grade
Data and Graphing
Kids completing this third grade math worksheet use a chart to compare data and solve addition problems.
Worksheet
Using a Chart: Do Your Chores!
Worksheet
Using a Chart: Do Your Chores!
Kids completing this third grade math worksheet use a chart to compare data and solve addition problems.
Third Grade
Data and Graphing
Worksheet
Probability Practice: Worms
Worksheet
Probability Practice: Worms
Fourth Grade
Data and Graphing
The early bird gets the worm! But which one will he choose? Have your child practice determining probability with a fun, visual exercise.
Worksheet
Probability Practice: Worms
Worksheet
Probability Practice: Worms
The early bird gets the worm! But which one will he choose? Have your child practice determining probability with a fun, visual exercise.
Fourth Grade
Data and Graphing
Worksheet
Create a Line Plot with Data Provided
Worksheet
Create a Line Plot with Data Provided
Third Grade
Data and Graphing
Use the data provided to have your students create a line plot that reflects how much TV watched per week for one third grade class.
Worksheet
Create a Line Plot with Data Provided
Worksheet
Create a Line Plot with Data Provided
Use the data provided to have your students create a line plot that reflects how much TV watched per week for one third grade class.
Third Grade
Data and Graphing
Worksheet
Scaled Bar Graphs
Exercise
Scaled Bar Graphs
Third Grade
Data and Graphing
This exercise will clarify just how scaled bar graphs represent data found in math problems.
Exercise
Scaled Bar Graphs
Exercise
Scaled Bar Graphs
This exercise will clarify just how scaled bar graphs represent data found in math problems.
Third Grade
Data and Graphing
Exercise
Bar Graph: Getting to School
Worksheet
Bar Graph: Getting to School
Third Grade
Data and Graphing
Kids completing this third grade math worksheet use a bar graph to compare data about transportation to school and solve addition and subtraction problems.
Worksheet
Bar Graph: Getting to School
Worksheet
Bar Graph: Getting to School
Kids completing this third grade math worksheet use a bar graph to compare data about transportation to school and solve addition and subtraction problems.
Third Grade
Data and Graphing
Worksheet
1
2
3