SKIP TO CONTENT
Worksheet Generator
Subjects
Grades
Worksheets
Games
Build a Worksheet
More Resources
Roly Recommends
Reading Month
Subjects
Grades
Worksheets
Games
Build a Worksheet
More Resources
Roly Recommends
Reading Month
All Subjects
Math
Data and Graphing
Subtopics:
Collecting and Organizing Data
Picture Graphs
Bar Graphs
Coordinate Plane
Show Less
Filters
Search for: day, life, president
✕
Math
✕
2nd - 4th Grade
✕
Subjects
Math
English Language Arts
Science
Social Studies
Foreign Language
Grade Level
Pre-K
K
1st
2nd
3rd
4th
5th
6th
7th
8th
Early Childhood
Elementary School
Middle School
Resource Type
Worksheets
Lesson Plans
Activities
Occasion
St. Patrick's Day
Summer
Holidays
Valentine's Day
Common Core
Yes
English Language Support
Yes
See More
Clear All
View 18 results
Showing Results for day life president
18 results
Search for: day, life, president
✕
Math
✕
2nd - 4th Grade
✕
Clear All
Sort by:
Relevance
Most recent
Most popular
Alphabetical A-Z
Alphabetical Z-A
All filters
18 results
Sort by:
Relevance
Most recent
Most popular
Alphabetical A-Z
Alphabetical Z-A
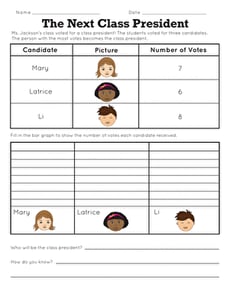
The Next Class President
Worksheet
The Next Class President
Second Grade
Numbers and Counting
In this beginning data and graphing worksheet, kindergartners and first graders get an introduction to the process of voting and outcomes.
Worksheet
The Next Class President
Worksheet
The Next Class President
In this beginning data and graphing worksheet, kindergartners and first graders get an introduction to the process of voting and outcomes.
Second Grade
Numbers and Counting
Worksheet
Math + Love = Valentine's Day Bar Graph
Lesson Plan
Math + Love = Valentine's Day Bar Graph
Second Grade
Data and Graphing
What's more romantic than a bar graph on Valentine's Day? In this Valentine's Day lesson plan, students will use information from a data set to create their own tally charts and bar graphs and then analyze these graphs to answer questions.
Lesson Plan
Math + Love = Valentine's Day Bar Graph
Lesson Plan
Math + Love = Valentine's Day Bar Graph
What's more romantic than a bar graph on Valentine's Day? In this Valentine's Day lesson plan, students will use information from a data set to create their own tally charts and bar graphs and then analyze these graphs to answer questions.
Second Grade
Data and Graphing
Lesson Plan
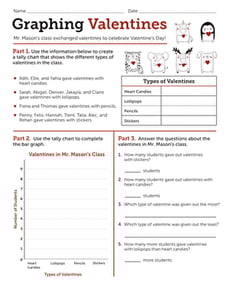
Graphing Valentines
Worksheet
Graphing Valentines
Second Grade
Data and Graphing
In this Valentine's Day math worksheet, learners will tally, graph, and interpret data about a classroom gift exchange.
Worksheet
Graphing Valentines
Worksheet
Graphing Valentines
In this Valentine's Day math worksheet, learners will tally, graph, and interpret data about a classroom gift exchange.
Second Grade
Data and Graphing
Worksheet
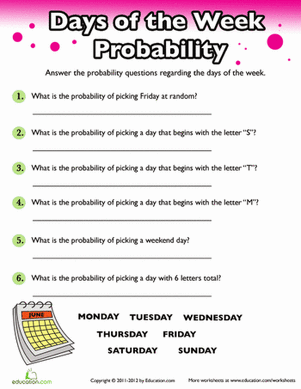
Probability: Days of the Week
Worksheet
Probability: Days of the Week
Fourth Grade
Data and Graphing
Practice probability with the days of the week! Your child will learn to find the probability of picking a random day on the calendar.
Worksheet
Probability: Days of the Week
Worksheet
Probability: Days of the Week
Practice probability with the days of the week! Your child will learn to find the probability of picking a random day on the calendar.
Fourth Grade
Data and Graphing
Worksheet
Leprechaun Chase
Activity
Leprechaun Chase
Third Grade
Geometry
This St. Patrick's day, stretch your third grader's social studies and math skills with this fun, cooperative learning game.
Activity
Leprechaun Chase
Activity
Leprechaun Chase
This St. Patrick's day, stretch your third grader's social studies and math skills with this fun, cooperative learning game.
Third Grade
Geometry
Activity
Bar Graphs: Interpreting Data
Lesson Plan
Bar Graphs: Interpreting Data
Second Grade
Data and Graphing
In this lesson, students will make bar graphs and interpret data using real-life data from other students. They will get practice writing and answering survey questions.
Lesson Plan
Bar Graphs: Interpreting Data
Lesson Plan
Bar Graphs: Interpreting Data
In this lesson, students will make bar graphs and interpret data using real-life data from other students. They will get practice writing and answering survey questions.
Second Grade
Data and Graphing
Lesson Plan
Pool Toys Pie Chart
Worksheet
Pool Toys Pie Chart
Second Grade
Data and Graphing
Sue found out people's favorite pool toys and posted her results in a pie chart. Students practice their analytical skills by coming up their own questions.
Worksheet
Pool Toys Pie Chart
Worksheet
Pool Toys Pie Chart
Sue found out people's favorite pool toys and posted her results in a pie chart. Students practice their analytical skills by coming up their own questions.
Second Grade
Data and Graphing
Worksheet
Interpreting Line Plots with Fractional Units
Worksheet
Interpreting Line Plots with Fractional Units
Third Grade
Data and Graphing
In this third grade worksheet, kids will interpret a line plot that includes fractional units.
Worksheet
Interpreting Line Plots with Fractional Units
Worksheet
Interpreting Line Plots with Fractional Units
In this third grade worksheet, kids will interpret a line plot that includes fractional units.
Third Grade
Data and Graphing
Worksheet
Track the Weather with Weather Charts
Activity
Track the Weather with Weather Charts
Third Grade
Measurement
Learn about the microclimate of your backyard by tracking rainfall, temperature, and observed weather with hand drawn charts and graphs.
Activity
Track the Weather with Weather Charts
Activity
Track the Weather with Weather Charts
Learn about the microclimate of your backyard by tracking rainfall, temperature, and observed weather with hand drawn charts and graphs.
Third Grade
Measurement
Activity
Pictograph Graph: Mr. Postman
Worksheet
Pictograph Graph: Mr. Postman
Second Grade
Data and Graphing
Boost your child's data know-how with a lesson on reading and understanding a math pictograph, a kind of graph in which pictures stand in for number data.
Worksheet
Pictograph Graph: Mr. Postman
Worksheet
Pictograph Graph: Mr. Postman
Boost your child's data know-how with a lesson on reading and understanding a math pictograph, a kind of graph in which pictures stand in for number data.
Second Grade
Data and Graphing
Worksheet
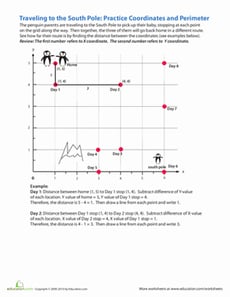
Practice Coordinates and Perimeter with Penguins
Worksheet
Practice Coordinates and Perimeter with Penguins
Fourth Grade
Data and Graphing
Your fourth grader won't even recognize that he's doing math as he helps his penguin friends reach their baby by determining the distance between coordinates.
Worksheet
Practice Coordinates and Perimeter with Penguins
Worksheet
Practice Coordinates and Perimeter with Penguins
Your fourth grader won't even recognize that he's doing math as he helps his penguin friends reach their baby by determining the distance between coordinates.
Fourth Grade
Data and Graphing
Worksheet
Subtraction Action
Activity
Subtraction Action
Third Grade
Data and Graphing
Most parents probably wouldn't mind subtracting 8-9 years off their age. Here's a fun third grade subtraction activity that may do just that.
Activity
Subtraction Action
Activity
Subtraction Action
Most parents probably wouldn't mind subtracting 8-9 years off their age. Here's a fun third grade subtraction activity that may do just that.
Third Grade
Data and Graphing
Activity
Summer Bar Graph
Activity
Summer Bar Graph
First Grade
Data and Graphing
Draw some educational value out of a summer stocked full of adventures!
Activity
Summer Bar Graph
Activity
Summer Bar Graph
Draw some educational value out of a summer stocked full of adventures!
First Grade
Data and Graphing
Activity
Do We Wear the Same Colors?
Activity
Do We Wear the Same Colors?
Third Grade
Data and Graphing
Hone observational skills and introduce the basics of data interpretation with this data gathering activity all about the different colors people wear.
Activity
Do We Wear the Same Colors?
Activity
Do We Wear the Same Colors?
Hone observational skills and introduce the basics of data interpretation with this data gathering activity all about the different colors people wear.
Third Grade
Data and Graphing
Activity
Mighty Mean, Median, and Mode
Lesson Plan
Mighty Mean, Median, and Mode
Fourth Grade
Data and Graphing
Give your students a good basis in interpreting data with this lesson that teaches them about mean, median, and mode with plenty of practice and cute videos to keep them interested.
Lesson Plan
Mighty Mean, Median, and Mode
Lesson Plan
Mighty Mean, Median, and Mode
Give your students a good basis in interpreting data with this lesson that teaches them about mean, median, and mode with plenty of practice and cute videos to keep them interested.
Fourth Grade
Data and Graphing
Lesson Plan
Household Energy Consumption
Activity
Household Energy Consumption
Third Grade
Multiplication
Challenge your third-grader to sharpen her new math skills--and maybe do the planet a favor, too.
Activity
Household Energy Consumption
Activity
Household Energy Consumption
Challenge your third-grader to sharpen her new math skills--and maybe do the planet a favor, too.
Third Grade
Multiplication
Activity
Why Do Leaves Change Color?
Activity
Why Do Leaves Change Color?
Second Grade
Data and Graphing
Engage your children with this fun fall activity that integrates math and science. First, your child will excavate to find leaves. Next, they'll examine them to determine the colors. Then, your child will graph their findings.
Activity
Why Do Leaves Change Color?
Activity
Why Do Leaves Change Color?
Engage your children with this fun fall activity that integrates math and science. First, your child will excavate to find leaves. Next, they'll examine them to determine the colors. Then, your child will graph their findings.
Second Grade
Data and Graphing
Activity
Mean, Median and Mode Madness!
Lesson Plan
Mean, Median and Mode Madness!
Third Grade
Data and Graphing
This lesson introduces students to the concepts of mean, median, and mode in a hands-on and visual way.
Lesson Plan
Mean, Median and Mode Madness!
Lesson Plan
Mean, Median and Mode Madness!
This lesson introduces students to the concepts of mean, median, and mode in a hands-on and visual way.
Third Grade
Data and Graphing
Lesson Plan
1