SKIP TO CONTENT
Worksheet Generator
Subjects
Grades
Worksheets
Games
Build a Worksheet
More Resources
Roly Recommends
Subjects
Grades
Worksheets
Games
Build a Worksheet
More Resources
Roly Recommends
All Subjects
Math
Data and Graphing
Subtopics:
Collecting and Organizing Data
Picture Graphs
Bar Graphs
Line Plots
Show Less
Filters
Search for: comma, before, closer, 1
✕
Math
✕
2nd - 4th Grade
✕
Subjects
Math
English Language Arts
Science
Social Studies
Foreign Language
Grade Level
Pre-K
K
1st
2nd
3rd
4th
5th
6th
7th
8th
Early Childhood
Elementary School
Middle School
Resource Type
Worksheets
Lesson Plans
Activities
Exercises
Offline Games
Guided Lessons
Occasion
Birthdays
Summer
Halloween
Holidays
Hanukkah
Valentine's Day
Common Core
Yes
English Language Support
Yes
See More
Clear All
View 39 results
Showing Results for comma before closer 1
39 results
Search for: comma, before, closer, 1
✕
Math
✕
2nd - 4th Grade
✕
Clear All
Sort by:
Relevance
Most recent
Most popular
Alphabetical A-Z
Alphabetical Z-A
All filters
39 results
Sort by:
Relevance
Most recent
Most popular
Alphabetical A-Z
Alphabetical Z-A
Data 1
Guided Lesson
Data 1
Third Grade
Fractions
Learning how to represent numerical information is a key part of the third grade math curriculum. This lesson in data provides guided instruction designed by our team of curriculum experts and teachers to present this concept in an engaging way. Not only that, but helpful exercises help kids to see the practical applicaton of these skills in the real world.
Guided Lesson
Data 1
Guided Lesson
Data 1
Learning how to represent numerical information is a key part of the third grade math curriculum. This lesson in data provides guided instruction designed by our team of curriculum experts and teachers to present this concept in an engaging way. Not only that, but helpful exercises help kids to see the practical applicaton of these skills in the real world.
Third Grade
Fractions
Guided Lesson
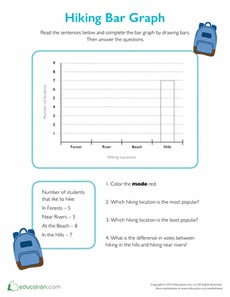
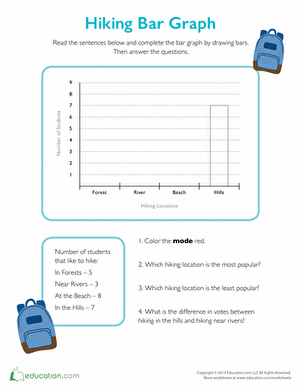
Bar Graph for Kids: Hiking Spots
Worksheet
Bar Graph for Kids: Hiking Spots
Second Grade
Data and Graphing
Before putting on those hiking boots, you might want to find out which spots are the most popular. Grab a red crayon and complete this bar graph.
Worksheet
Bar Graph for Kids: Hiking Spots
Worksheet
Bar Graph for Kids: Hiking Spots
Before putting on those hiking boots, you might want to find out which spots are the most popular. Grab a red crayon and complete this bar graph.
Second Grade
Data and Graphing
Worksheet
Measurement and Graphing 1
Exercise
Measurement and Graphing 1
Third Grade
Fractions
This exercise will introduce students to the concept of taking measurements and graphing the data.
Exercise
Measurement and Graphing 1
Exercise
Measurement and Graphing 1
This exercise will introduce students to the concept of taking measurements and graphing the data.
Third Grade
Fractions
Exercise
Probability and Statistics 1
Exercise
Probability and Statistics 1
Third Grade
Data and Graphing
This engaging exercise will introduce students to probability and statistics in a way that excites them to continue learning.
Exercise
Probability and Statistics 1
Exercise
Probability and Statistics 1
This engaging exercise will introduce students to probability and statistics in a way that excites them to continue learning.
Third Grade
Data and Graphing
Exercise
Collecting and Organizing Data 1
Exercise
Collecting and Organizing Data 1
Third Grade
Data and Graphing
Students will learn how to collect and organize data thanks to this interesting exercise from Education.com.
Exercise
Collecting and Organizing Data 1
Exercise
Collecting and Organizing Data 1
Students will learn how to collect and organize data thanks to this interesting exercise from Education.com.
Third Grade
Data and Graphing
Exercise
Practice Reading Venn Diagrams #1: Favorite Hobby
Worksheet
Practice Reading Venn Diagrams #1: Favorite Hobby
Second Grade
Data and Graphing
Kids practice reading a Venn diagram about favorite hobbies and answer questions about it in this 2nd grade math worksheet.
Worksheet
Practice Reading Venn Diagrams #1: Favorite Hobby
Worksheet
Practice Reading Venn Diagrams #1: Favorite Hobby
Kids practice reading a Venn diagram about favorite hobbies and answer questions about it in this 2nd grade math worksheet.
Second Grade
Data and Graphing
Worksheet
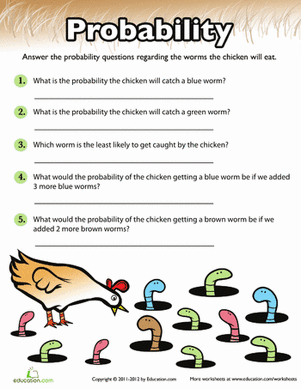
Probability Practice: Worms
Worksheet
Probability Practice: Worms
Fourth Grade
Data and Graphing
The early bird gets the worm! But which one will he choose? Have your child practice determining probability with a fun, visual exercise.
Worksheet
Probability Practice: Worms
Worksheet
Probability Practice: Worms
The early bird gets the worm! But which one will he choose? Have your child practice determining probability with a fun, visual exercise.
Fourth Grade
Data and Graphing
Worksheet
Create a Line Plot with Data Provided
Worksheet
Create a Line Plot with Data Provided
Third Grade
Data and Graphing
Use the data provided to have your students create a line plot that reflects how much TV watched per week for one third grade class.
Worksheet
Create a Line Plot with Data Provided
Worksheet
Create a Line Plot with Data Provided
Use the data provided to have your students create a line plot that reflects how much TV watched per week for one third grade class.
Third Grade
Data and Graphing
Worksheet
Measurement and Data 4
Guided Lesson
Measurement and Data 4
Fourth Grade
Fractions
Representing data on graphs makes math visual and involves some creativity and design. Plotting data using fractional units takes their learning one step further. Also in this unit, students learn to measure using both traditional units (like inches, feet and yards) and metric units, and how to convert measurements within each system. The concept of measurement gets two dimensional when students explore measuring and working with angles.
Guided Lesson
Measurement and Data 4
Guided Lesson
Measurement and Data 4
Representing data on graphs makes math visual and involves some creativity and design. Plotting data using fractional units takes their learning one step further. Also in this unit, students learn to measure using both traditional units (like inches, feet and yards) and metric units, and how to convert measurements within each system. The concept of measurement gets two dimensional when students explore measuring and working with angles.
Fourth Grade
Fractions
Guided Lesson
Pool Toys Pie Chart
Worksheet
Pool Toys Pie Chart
Second Grade
Data and Graphing
Sue found out people's favorite pool toys and posted her results in a pie chart. Students practice their analytical skills by coming up their own questions.
Worksheet
Pool Toys Pie Chart
Worksheet
Pool Toys Pie Chart
Sue found out people's favorite pool toys and posted her results in a pie chart. Students practice their analytical skills by coming up their own questions.
Second Grade
Data and Graphing
Worksheet
Summer Bar Graph
Activity
Summer Bar Graph
First Grade
Data and Graphing
Draw some educational value out of a summer stocked full of adventures!
Activity
Summer Bar Graph
Activity
Summer Bar Graph
Draw some educational value out of a summer stocked full of adventures!
First Grade
Data and Graphing
Activity
Track the Weather with Weather Charts
Activity
Track the Weather with Weather Charts
Third Grade
Measurement
Learn about the microclimate of your backyard by tracking rainfall, temperature, and observed weather with hand drawn charts and graphs.
Activity
Track the Weather with Weather Charts
Activity
Track the Weather with Weather Charts
Learn about the microclimate of your backyard by tracking rainfall, temperature, and observed weather with hand drawn charts and graphs.
Third Grade
Measurement
Activity
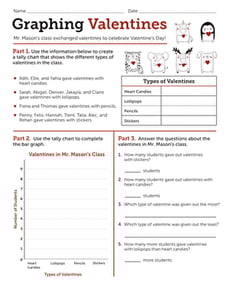
Graphing Valentines
Worksheet
Graphing Valentines
Second Grade
Data and Graphing
In this Valentine's Day math worksheet, learners will tally, graph, and interpret data about a classroom gift exchange.
Worksheet
Graphing Valentines
Worksheet
Graphing Valentines
In this Valentine's Day math worksheet, learners will tally, graph, and interpret data about a classroom gift exchange.
Second Grade
Data and Graphing
Worksheet
What is it Telling Me? Creating and Interpreting Line Plots
Lesson Plan
What is it Telling Me? Creating and Interpreting Line Plots
Third Grade
Data and Graphing
Line plots are a great way to introduce your students to graphing data. In this lesson, your students will learn how to create a line plot and also practice interpreting line plots.
Lesson Plan
What is it Telling Me? Creating and Interpreting Line Plots
Lesson Plan
What is it Telling Me? Creating and Interpreting Line Plots
Line plots are a great way to introduce your students to graphing data. In this lesson, your students will learn how to create a line plot and also practice interpreting line plots.
Third Grade
Data and Graphing
Lesson Plan
Dice Probability
Activity
Dice Probability
Fourth Grade
Data and Graphing
Analyze this simple betting game with your fourth grade student in order to discuss probability.
Activity
Dice Probability
Activity
Dice Probability
Analyze this simple betting game with your fourth grade student in order to discuss probability.
Fourth Grade
Data and Graphing
Activity
Let's Graph Our Fall Favorites!
Lesson Plan
Let's Graph Our Fall Favorites!
Second Grade
Data and Graphing
This engaging math lesson combines all of your kid's fall favorites as they learn to represent data using a bar graph.
Lesson Plan
Let's Graph Our Fall Favorites!
Lesson Plan
Let's Graph Our Fall Favorites!
This engaging math lesson combines all of your kid's fall favorites as they learn to represent data using a bar graph.
Second Grade
Data and Graphing
Lesson Plan
Sweet Sorting: A Fun Activity to Practice Categorizing
Activity
Sweet Sorting: A Fun Activity to Practice Categorizing
Third Grade
Data and Graphing
Delay your child's sugar overload, and develop his critical thinking skills, by doing some "sweet sorting" of his Halloween treasures!
Activity
Sweet Sorting: A Fun Activity to Practice Categorizing
Activity
Sweet Sorting: A Fun Activity to Practice Categorizing
Delay your child's sugar overload, and develop his critical thinking skills, by doing some "sweet sorting" of his Halloween treasures!
Third Grade
Data and Graphing
Activity
What Doesn't Belong? A Categorization Game
Activity
What Doesn't Belong? A Categorization Game
Third Grade
Data and Graphing
This educated-guessing game is great for preschoolers. This activity helps your child work on her reasoning skills.
Activity
What Doesn't Belong? A Categorization Game
Activity
What Doesn't Belong? A Categorization Game
This educated-guessing game is great for preschoolers. This activity helps your child work on her reasoning skills.
Third Grade
Data and Graphing
Activity
Study of Names
Activity
Study of Names
Third Grade
Data and Graphing
Graph are a great way to organize information. Your child will get to practice graphing by creating a bar graph and a pictorial graph of her friend's names.
Activity
Study of Names
Activity
Study of Names
Graph are a great way to organize information. Your child will get to practice graphing by creating a bar graph and a pictorial graph of her friend's names.
Third Grade
Data and Graphing
Activity
Comparing Pictographs: Taxi, Taxi
Worksheet
Comparing Pictographs: Taxi, Taxi
Third Grade
Addition
In this 3rd grade math worksheet, kids analyze and compare data in two pictographs in order to answer a set of word problems.
Worksheet
Comparing Pictographs: Taxi, Taxi
Worksheet
Comparing Pictographs: Taxi, Taxi
In this 3rd grade math worksheet, kids analyze and compare data in two pictographs in order to answer a set of word problems.
Third Grade
Addition
Worksheet
Probability Game
Activity
Probability Game
Third Grade
Data and Graphing
Probability can be a tough concept to master. Try playing this fun card game in order to help your third grader understand it a little better.
Activity
Probability Game
Activity
Probability Game
Probability can be a tough concept to master. Try playing this fun card game in order to help your third grader understand it a little better.
Third Grade
Data and Graphing
Activity
Math + Love = Valentine's Day Bar Graph
Lesson Plan
Math + Love = Valentine's Day Bar Graph
Second Grade
Data and Graphing
What's more romantic than a bar graph on Valentine's Day? In this Valentine's Day lesson plan, students will use information from a data set to create their own tally charts and bar graphs and then analyze these graphs to answer questions.
Lesson Plan
Math + Love = Valentine's Day Bar Graph
Lesson Plan
Math + Love = Valentine's Day Bar Graph
What's more romantic than a bar graph on Valentine's Day? In this Valentine's Day lesson plan, students will use information from a data set to create their own tally charts and bar graphs and then analyze these graphs to answer questions.
Second Grade
Data and Graphing
Lesson Plan
Why Do Leaves Change Color?
Activity
Why Do Leaves Change Color?
Second Grade
Data and Graphing
Engage your children with this fun fall activity that integrates math and science. First, your child will excavate to find leaves. Next, they'll examine them to determine the colors. Then, your child will graph their findings.
Activity
Why Do Leaves Change Color?
Activity
Why Do Leaves Change Color?
Engage your children with this fun fall activity that integrates math and science. First, your child will excavate to find leaves. Next, they'll examine them to determine the colors. Then, your child will graph their findings.
Second Grade
Data and Graphing
Activity
Household Energy Consumption
Activity
Household Energy Consumption
Third Grade
Multiplication
Challenge your third-grader to sharpen her new math skills--and maybe do the planet a favor, too.
Activity
Household Energy Consumption
Activity
Household Energy Consumption
Challenge your third-grader to sharpen her new math skills--and maybe do the planet a favor, too.
Third Grade
Multiplication
Activity
Probability Practice: Birds
Worksheet
Probability Practice: Birds
Fourth Grade
Data and Graphing
Practice probability and fractions with some feathery friends! In this exercise, your child will determine the likelihood of certain birds flying away.
Worksheet
Probability Practice: Birds
Worksheet
Probability Practice: Birds
Practice probability and fractions with some feathery friends! In this exercise, your child will determine the likelihood of certain birds flying away.
Fourth Grade
Data and Graphing
Worksheet
Make a Menorah Light Chart
Activity
Make a Menorah Light Chart
Second Grade
Data and Graphing
Your child can brush up on her math skills by charting the length of time that each candle on the menorah takes to burn.
Activity
Make a Menorah Light Chart
Activity
Make a Menorah Light Chart
Your child can brush up on her math skills by charting the length of time that each candle on the menorah takes to burn.
Second Grade
Data and Graphing
Activity
Practice Graphs
Worksheet
Practice Graphs
Second Grade
Data and Graphing
Kids practice representing a set of data using three kinds of graphs: a bar graph, pictograph, and pie graph.
Worksheet
Practice Graphs
Worksheet
Practice Graphs
Kids practice representing a set of data using three kinds of graphs: a bar graph, pictograph, and pie graph.
Second Grade
Data and Graphing
Worksheet
Mighty Mean, Median, and Mode
Lesson Plan
Mighty Mean, Median, and Mode
Fourth Grade
Data and Graphing
Give your students a good basis in interpreting data with this lesson that teaches them about mean, median, and mode with plenty of practice and cute videos to keep them interested.
Lesson Plan
Mighty Mean, Median, and Mode
Lesson Plan
Mighty Mean, Median, and Mode
Give your students a good basis in interpreting data with this lesson that teaches them about mean, median, and mode with plenty of practice and cute videos to keep them interested.
Fourth Grade
Data and Graphing
Lesson Plan
Practice Reading Venn Diagrams #3: Favorite Dessert
Worksheet
Practice Reading Venn Diagrams #3: Favorite Dessert
Second Grade
Data and Graphing
Kids practice reading a Venn diagram about favorite desserts and answer questions about it in this 2nd grade math worksheet.
Worksheet
Practice Reading Venn Diagrams #3: Favorite Dessert
Worksheet
Practice Reading Venn Diagrams #3: Favorite Dessert
Kids practice reading a Venn diagram about favorite desserts and answer questions about it in this 2nd grade math worksheet.
Second Grade
Data and Graphing
Worksheet
Draw a Birthday Bar Graph
Activity
Draw a Birthday Bar Graph
Third Grade
Data and Graphing
Liven up a lesson about graphing by helping your third grader compile a bar graph from his classmates' birthday data.
Activity
Draw a Birthday Bar Graph
Activity
Draw a Birthday Bar Graph
Liven up a lesson about graphing by helping your third grader compile a bar graph from his classmates' birthday data.
Third Grade
Data and Graphing
Activity
1
2