SKIP TO CONTENT
Worksheet Generator
Subjects
Grades
Worksheets
Games
Build a Worksheet
More Resources
Roly Recommends
Subjects
Grades
Worksheets
Games
Build a Worksheet
More Resources
Roly Recommends
All Subjects
Math
Data and Graphing
Subtopics:
Collecting and Organizing Data
Picture Graphs
Bar Graphs
Line Plots
Show Less
Filters
Search for: compare, with, different, denominators, 2
✕
Math
✕
2nd and 3rd Grade
✕
Common Core
✕
Subjects
Math
English Language Arts
Science
Social Studies
Grade Level
Pre-K
K
1st
2nd
3rd
4th
5th
6th
7th
8th
Early Childhood
Elementary School
Middle School
Resource Type
Worksheets
Games
Lesson Plans
Workbooks
Activities
Occasion
Back to School
Common Core
Yes
English Language Support
Yes
See More
Clear All
View 21 results
Showing Results for compare with different denominators 2
21 results
Search for: compare, with, different, denominators, 2
✕
Math
✕
2nd and 3rd Grade
✕
Common Core
✕
Clear All
Sort by:
Relevance
Most recent
Most popular
Alphabetical A-Z
Alphabetical Z-A
All filters
21 results
Sort by:
Relevance
Most recent
Most popular
Alphabetical A-Z
Alphabetical Z-A
Comparing Pictographs: Football Time
Worksheet
Comparing Pictographs: Football Time
Third Grade
Data and Graphing
In this math worksheet, kids compare two pictographs that record the number of footballs kicked and the number of footballs thrown on the field.
Worksheet
Comparing Pictographs: Football Time
Worksheet
Comparing Pictographs: Football Time
In this math worksheet, kids compare two pictographs that record the number of footballs kicked and the number of footballs thrown on the field.
Third Grade
Data and Graphing
Worksheet
Comparing Pictographs: Taxi, Taxi
Worksheet
Comparing Pictographs: Taxi, Taxi
Third Grade
Addition
In this 3rd grade math worksheet, kids analyze and compare data in two pictographs in order to answer a set of word problems.
Worksheet
Comparing Pictographs: Taxi, Taxi
Worksheet
Comparing Pictographs: Taxi, Taxi
In this 3rd grade math worksheet, kids analyze and compare data in two pictographs in order to answer a set of word problems.
Third Grade
Addition
Worksheet
Using Base 10 Drawings in Two-Digit Addition
Worksheet
Using Base 10 Drawings in Two-Digit Addition
Second Grade
Addition
This worksheet teaches you to use base 10 drawings to add two-digit numbers.
Worksheet
Using Base 10 Drawings in Two-Digit Addition
Worksheet
Using Base 10 Drawings in Two-Digit Addition
This worksheet teaches you to use base 10 drawings to add two-digit numbers.
Second Grade
Addition
Worksheet
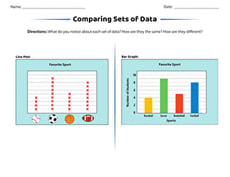
Comparing Sets of Data
Worksheet
Comparing Sets of Data
Second Grade
Data and Graphing
Want to help your students begin to think critically about data? Laminate and display this worksheet to spark discussion about different ways to represent data.
Worksheet
Comparing Sets of Data
Worksheet
Comparing Sets of Data
Want to help your students begin to think critically about data? Laminate and display this worksheet to spark discussion about different ways to represent data.
Second Grade
Data and Graphing
Worksheet
Pictograph Practice: Hamburger Cafe
Worksheet
Pictograph Practice: Hamburger Cafe
Second Grade
Data and Graphing
Pictographs are a great introduction to working with data and graphs. Kids help the hamburger cafe compare the number of hamburgers they sold using pictographs.
Worksheet
Pictograph Practice: Hamburger Cafe
Worksheet
Pictograph Practice: Hamburger Cafe
Pictographs are a great introduction to working with data and graphs. Kids help the hamburger cafe compare the number of hamburgers they sold using pictographs.
Second Grade
Data and Graphing
Worksheet
Bar Graph: Getting to School
Worksheet
Bar Graph: Getting to School
Third Grade
Data and Graphing
Kids completing this third grade math worksheet use a bar graph to compare data about transportation to school and solve addition and subtraction problems.
Worksheet
Bar Graph: Getting to School
Worksheet
Bar Graph: Getting to School
Kids completing this third grade math worksheet use a bar graph to compare data about transportation to school and solve addition and subtraction problems.
Third Grade
Data and Graphing
Worksheet
Reading a Bar Graph: Number of Athletes
Worksheet
Reading a Bar Graph: Number of Athletes
Third Grade
Data and Graphing
In this sports-themed worksheet, children use a bar graph to answer six questions about the number of athletes playing at a time in a variety of sporting events.
Worksheet
Reading a Bar Graph: Number of Athletes
Worksheet
Reading a Bar Graph: Number of Athletes
In this sports-themed worksheet, children use a bar graph to answer six questions about the number of athletes playing at a time in a variety of sporting events.
Third Grade
Data and Graphing
Worksheet
Data and Graphing
Workbook
Data and Graphing
Third Grade
Data and Graphing
Become a master of analysis! In this series, kids practice collecting, creating and plotting data on graphs. Then they'll practice reading graphs, making predictions, and comparing data.
Workbook
Data and Graphing
Workbook
Data and Graphing
Become a master of analysis! In this series, kids practice collecting, creating and plotting data on graphs. Then they'll practice reading graphs, making predictions, and comparing data.
Third Grade
Data and Graphing
Workbook
Christmas Graphing
Worksheet
Christmas Graphing
Second Grade
Data and Graphing
Use a pictograph to find out how many presents Minnie wrapped this year.
Worksheet
Christmas Graphing
Worksheet
Christmas Graphing
Use a pictograph to find out how many presents Minnie wrapped this year.
Second Grade
Data and Graphing
Worksheet
Using Election Data
Worksheet
Using Election Data
Second Grade
Data and Graphing
Practice reading election data with this data analysis worksheet!
Worksheet
Using Election Data
Worksheet
Using Election Data
Practice reading election data with this data analysis worksheet!
Second Grade
Data and Graphing
Worksheet
Word Problems: Interpreting Line Plots
Worksheet
Word Problems: Interpreting Line Plots
Second Grade
Data and Graphing
Students will have a chance to practice solving word problems using line plots with this worksheet.
Worksheet
Word Problems: Interpreting Line Plots
Worksheet
Word Problems: Interpreting Line Plots
Students will have a chance to practice solving word problems using line plots with this worksheet.
Second Grade
Data and Graphing
Worksheet
Practice Graphs
Worksheet
Practice Graphs
Second Grade
Data and Graphing
Kids practice representing a set of data using three kinds of graphs: a bar graph, pictograph, and pie graph.
Worksheet
Practice Graphs
Worksheet
Practice Graphs
Kids practice representing a set of data using three kinds of graphs: a bar graph, pictograph, and pie graph.
Second Grade
Data and Graphing
Worksheet
Zap and Kreb: Graphing Word Problems
Game
Zap and Kreb: Graphing Word Problems
Third Grade
Data and Graphing
Kids journey to Earth with aliens Zap and Kreb on a mission to gather data and create graphs in a math story that's out of this world!
Game
Zap and Kreb: Graphing Word Problems
Game
Zap and Kreb: Graphing Word Problems
Kids journey to Earth with aliens Zap and Kreb on a mission to gather data and create graphs in a math story that's out of this world!
Third Grade
Data and Graphing
Game
Let's Graph Our Fall Favorites!
Lesson Plan
Let's Graph Our Fall Favorites!
Second Grade
Data and Graphing
This engaging math lesson combines all of your kid's fall favorites as they learn to represent data using a bar graph.
Lesson Plan
Let's Graph Our Fall Favorites!
Lesson Plan
Let's Graph Our Fall Favorites!
This engaging math lesson combines all of your kid's fall favorites as they learn to represent data using a bar graph.
Second Grade
Data and Graphing
Lesson Plan
Flower Pie Chart
Worksheet
Flower Pie Chart
Second Grade
Data and Graphing
Even if your child isn't ready for statistics, he can learn to get his bearings around charts and graphs with this simple flower-themed pie chart worksheet.
Worksheet
Flower Pie Chart
Worksheet
Flower Pie Chart
Even if your child isn't ready for statistics, he can learn to get his bearings around charts and graphs with this simple flower-themed pie chart worksheet.
Second Grade
Data and Graphing
Worksheet
Reading Pictographs: Eggplant Cooking
Worksheet
Reading Pictographs: Eggplant Cooking
Third Grade
Data and Graphing
Mr. Chef keeps track of how many eggplants he uses with a pictograph. In this worksheet, kids use information in the pictograph to answer word problems.
Worksheet
Reading Pictographs: Eggplant Cooking
Worksheet
Reading Pictographs: Eggplant Cooking
Mr. Chef keeps track of how many eggplants he uses with a pictograph. In this worksheet, kids use information in the pictograph to answer word problems.
Third Grade
Data and Graphing
Worksheet
What is it Telling Me? Creating and Interpreting Line Plots
Lesson Plan
What is it Telling Me? Creating and Interpreting Line Plots
Third Grade
Data and Graphing
Line plots are a great way to introduce your students to graphing data. In this lesson, your students will learn how to create a line plot and also practice interpreting line plots.
Lesson Plan
What is it Telling Me? Creating and Interpreting Line Plots
Lesson Plan
What is it Telling Me? Creating and Interpreting Line Plots
Line plots are a great way to introduce your students to graphing data. In this lesson, your students will learn how to create a line plot and also practice interpreting line plots.
Third Grade
Data and Graphing
Lesson Plan
Why Do Leaves Change Color?
Activity
Why Do Leaves Change Color?
Second Grade
Data and Graphing
Engage your children with this fun fall activity that integrates math and science. First, your child will excavate to find leaves. Next, they'll examine them to determine the colors. Then, your child will graph their findings.
Activity
Why Do Leaves Change Color?
Activity
Why Do Leaves Change Color?
Engage your children with this fun fall activity that integrates math and science. First, your child will excavate to find leaves. Next, they'll examine them to determine the colors. Then, your child will graph their findings.
Second Grade
Data and Graphing
Activity
Math + Love = Valentine's Day Bar Graph
Lesson Plan
Math + Love = Valentine's Day Bar Graph
Second Grade
Data and Graphing
What's more romantic than a bar graph on Valentine's Day? In this Valentine's Day lesson plan, students will use information from a data set to create their own tally charts and bar graphs and then analyze these graphs to answer questions.
Lesson Plan
Math + Love = Valentine's Day Bar Graph
Lesson Plan
Math + Love = Valentine's Day Bar Graph
What's more romantic than a bar graph on Valentine's Day? In this Valentine's Day lesson plan, students will use information from a data set to create their own tally charts and bar graphs and then analyze these graphs to answer questions.
Second Grade
Data and Graphing
Lesson Plan
Mean, Median and Mode Madness!
Lesson Plan
Mean, Median and Mode Madness!
Third Grade
Data and Graphing
This lesson introduces students to the concepts of mean, median, and mode in a hands-on and visual way.
Lesson Plan
Mean, Median and Mode Madness!
Lesson Plan
Mean, Median and Mode Madness!
This lesson introduces students to the concepts of mean, median, and mode in a hands-on and visual way.
Third Grade
Data and Graphing
Lesson Plan
Bar Graphs: Interpreting Data
Lesson Plan
Bar Graphs: Interpreting Data
Second Grade
Data and Graphing
In this lesson, students will make bar graphs and interpret data using real-life data from other students. They will get practice writing and answering survey questions.
Lesson Plan
Bar Graphs: Interpreting Data
Lesson Plan
Bar Graphs: Interpreting Data
In this lesson, students will make bar graphs and interpret data using real-life data from other students. They will get practice writing and answering survey questions.
Second Grade
Data and Graphing
Lesson Plan
1