SKIP TO CONTENT
Worksheet Generator
Subjects
Grades
Worksheets
Games
Build a Worksheet
More Resources
Roly Recommends
Subjects
Grades
Worksheets
Games
Build a Worksheet
More Resources
Roly Recommends
All Subjects
Math
Data and Graphing
Subtopics:
Collecting and Organizing Data
✕
Picture Graphs
Bar Graphs
Line Plots
Coordinate Plane
Show Less
Filters
Search for: fractions, like, denominators, 2
✕
Math
✕
1st - 5th Grade
✕
Subjects
Math
English Language Arts
Science
Social Studies
Foreign Language
Grade Level
Pre-K
K
1st
2nd
3rd
4th
5th
6th
7th
8th
Early Childhood
Elementary School
Middle School
Resource Type
Worksheets
Games
Lesson Plans
Interactive Worksheets
Activities
Exercises
Guided Lessons
Common Core
Yes
Arts & Crafts
Arts & Crafts
Paper & Glue Crafts
English Language Support
Yes
See More
Clear All
View 19 results
Showing Results for fractions like denominators 2
19 results
Search for: fractions, like, denominators, 2
✕
Math
✕
1st - 5th Grade
✕
Clear All
Sort by:
Relevance
Most recent
Most popular
Alphabetical A-Z
Alphabetical Z-A
All filters
19 results
Sort by:
Relevance
Most recent
Most popular
Alphabetical A-Z
Alphabetical Z-A
Data 2
Guided Lesson
Data 2
Fifth Grade
Fractions
Understanding data and graphs is a critical skill that we use on a regular basis to read news articles, reports and other media to interpret information. In this unit, students investigate data collection, data organization and visual representation in different kinds of graphics (i.e. line plots, pie charts). Learners also apply concepts of probability and statistics to analyze data.
Guided Lesson
Data 2
Guided Lesson
Data 2
Understanding data and graphs is a critical skill that we use on a regular basis to read news articles, reports and other media to interpret information. In this unit, students investigate data collection, data organization and visual representation in different kinds of graphics (i.e. line plots, pie charts). Learners also apply concepts of probability and statistics to analyze data.
Fifth Grade
Fractions
Guided Lesson
Measurement and Data 4
Guided Lesson
Measurement and Data 4
Fourth Grade
Fractions
Representing data on graphs makes math visual and involves some creativity and design. Plotting data using fractional units takes their learning one step further. Also in this unit, students learn to measure using both traditional units (like inches, feet and yards) and metric units, and how to convert measurements within each system. The concept of measurement gets two dimensional when students explore measuring and working with angles.
Guided Lesson
Measurement and Data 4
Guided Lesson
Measurement and Data 4
Representing data on graphs makes math visual and involves some creativity and design. Plotting data using fractional units takes their learning one step further. Also in this unit, students learn to measure using both traditional units (like inches, feet and yards) and metric units, and how to convert measurements within each system. The concept of measurement gets two dimensional when students explore measuring and working with angles.
Fourth Grade
Fractions
Guided Lesson
Collecting and Organizing Data 2
Exercise
Collecting and Organizing Data 2
Fourth Grade
Data and Graphing
Your students will grow adept at collecting and organizing data around them with this engaging exercise.
Exercise
Collecting and Organizing Data 2
Exercise
Collecting and Organizing Data 2
Your students will grow adept at collecting and organizing data around them with this engaging exercise.
Fourth Grade
Data and Graphing
Exercise
Sort 2D and 3D Shapes
Interactive Worksheet
Sort 2D and 3D Shapes
Kindergarten
Geometry
Can your kid tell the difference between 2-dimensional and 3-dimensional shapes? Kindergarten is a good time to start!
Interactive Worksheet
Sort 2D and 3D Shapes
Interactive Worksheet
Sort 2D and 3D Shapes
Can your kid tell the difference between 2-dimensional and 3-dimensional shapes? Kindergarten is a good time to start!
Kindergarten
Geometry
Interactive Worksheet
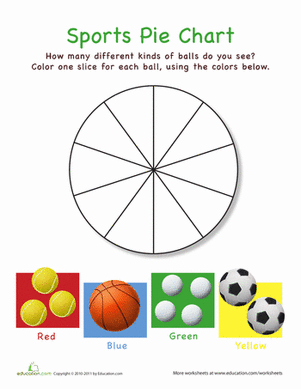
Sports Pie Chart
Worksheet
Sports Pie Chart
Second Grade
Data and Graphing
Help your child get his bearings around graphs and charts with this cute pie chart worksheet.
Worksheet
Sports Pie Chart
Worksheet
Sports Pie Chart
Help your child get his bearings around graphs and charts with this cute pie chart worksheet.
Second Grade
Data and Graphing
Worksheet
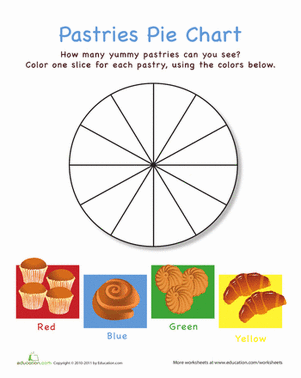
Pastries Pie Chart
Worksheet
Pastries Pie Chart
Second Grade
Data and Graphing
Help your child get her bearings around charts and graphs with this appealing pie chart worksheet.
Worksheet
Pastries Pie Chart
Worksheet
Pastries Pie Chart
Help your child get her bearings around charts and graphs with this appealing pie chart worksheet.
Second Grade
Data and Graphing
Worksheet
Let's Play Ball
Lesson Plan
Let's Play Ball
Third Grade
Multiplication
Students will have a ball with this data collection lesson plan where they learn about collecting and plotting data on a chart and line plot.
Lesson Plan
Let's Play Ball
Lesson Plan
Let's Play Ball
Students will have a ball with this data collection lesson plan where they learn about collecting and plotting data on a chart and line plot.
Third Grade
Multiplication
Lesson Plan
Explore Genetics by Finding Family Traits!
Activity
Explore Genetics by Finding Family Traits!
Fifth Grade
Data and Graphing
For a fun family activity to introduce your child to genetics, have your child go on a search for dominant and recessive family genes!
Activity
Explore Genetics by Finding Family Traits!
Activity
Explore Genetics by Finding Family Traits!
For a fun family activity to introduce your child to genetics, have your child go on a search for dominant and recessive family genes!
Fifth Grade
Data and Graphing
Activity
Picture Graphing with Fish
Game
Picture Graphing with Fish
Third Grade
Data and Graphing
Fish, fish everywhere! Kids catch fish to sort and graph in this zany game.
Game
Picture Graphing with Fish
Game
Picture Graphing with Fish
Fish, fish everywhere! Kids catch fish to sort and graph in this zany game.
Third Grade
Data and Graphing
Game
Bar Graphing with Eggs
Game
Bar Graphing with Eggs
Third Grade
Data and Graphing
It's raining eggs! Kids must move quickly to catch eggs for Farmer Brown, organizing and displaying the data using bar graphs in this silly game.
Game
Bar Graphing with Eggs
Game
Bar Graphing with Eggs
It's raining eggs! Kids must move quickly to catch eggs for Farmer Brown, organizing and displaying the data using bar graphs in this silly game.
Third Grade
Data and Graphing
Game
What Doesn't Belong? A Categorization Game
Activity
What Doesn't Belong? A Categorization Game
Third Grade
Data and Graphing
This educated-guessing game is great for preschoolers. This activity helps your child work on her reasoning skills.
Activity
What Doesn't Belong? A Categorization Game
Activity
What Doesn't Belong? A Categorization Game
This educated-guessing game is great for preschoolers. This activity helps your child work on her reasoning skills.
Third Grade
Data and Graphing
Activity
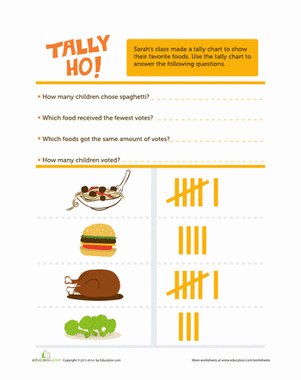
Tally Ho!
Worksheet
Tally Ho!
First Grade
Data and Graphing
Does you kid have a favorite food? This worksheet challenges him to count the number of votes on a chart, then answer some questions about the results.
Worksheet
Tally Ho!
Worksheet
Tally Ho!
Does you kid have a favorite food? This worksheet challenges him to count the number of votes on a chart, then answer some questions about the results.
First Grade
Data and Graphing
Worksheet
Why Do Leaves Change Color?
Activity
Why Do Leaves Change Color?
Second Grade
Data and Graphing
Engage your children with this fun fall activity that integrates math and science. First, your child will excavate to find leaves. Next, they'll examine them to determine the colors. Then, your child will graph their findings.
Activity
Why Do Leaves Change Color?
Activity
Why Do Leaves Change Color?
Engage your children with this fun fall activity that integrates math and science. First, your child will excavate to find leaves. Next, they'll examine them to determine the colors. Then, your child will graph their findings.
Second Grade
Data and Graphing
Activity
Chalk it Up! An Outdoor Classification Activity
Activity
Chalk it Up! An Outdoor Classification Activity
First Grade
Place Value
Get your child math and science savvy with this fun outdoor classification game. Using chalk, your child will classify what she sees in the natural world.
Activity
Chalk it Up! An Outdoor Classification Activity
Activity
Chalk it Up! An Outdoor Classification Activity
Get your child math and science savvy with this fun outdoor classification game. Using chalk, your child will classify what she sees in the natural world.
First Grade
Place Value
Activity
Bar Graphs: Interpreting Data
Lesson Plan
Bar Graphs: Interpreting Data
Second Grade
Data and Graphing
In this lesson, students will make bar graphs and interpret data using real-life data from other students. They will get practice writing and answering survey questions.
Lesson Plan
Bar Graphs: Interpreting Data
Lesson Plan
Bar Graphs: Interpreting Data
In this lesson, students will make bar graphs and interpret data using real-life data from other students. They will get practice writing and answering survey questions.
Second Grade
Data and Graphing
Lesson Plan
Graph My Design
Lesson Plan
Graph My Design
First Grade
Geometry
Geometry meets data in this fun lesson! Students will build a design using pattern blocks and then graph the number of each shape used. This scaffolded EL lesson can be used alone or alongside
Graphing Colored Counters.
Lesson Plan
Graph My Design
Lesson Plan
Graph My Design
Geometry meets data in this fun lesson! Students will build a design using pattern blocks and then graph the number of each shape used. This scaffolded EL lesson can be used alone or alongside
Graphing Colored Counters.
First Grade
Geometry
Lesson Plan
Math + Love = Valentine's Day Bar Graph
Lesson Plan
Math + Love = Valentine's Day Bar Graph
Second Grade
Data and Graphing
What's more romantic than a bar graph on Valentine's Day? In this Valentine's Day lesson plan, students will use information from a data set to create their own tally charts and bar graphs and then analyze these graphs to answer questions.
Lesson Plan
Math + Love = Valentine's Day Bar Graph
Lesson Plan
Math + Love = Valentine's Day Bar Graph
What's more romantic than a bar graph on Valentine's Day? In this Valentine's Day lesson plan, students will use information from a data set to create their own tally charts and bar graphs and then analyze these graphs to answer questions.
Second Grade
Data and Graphing
Lesson Plan
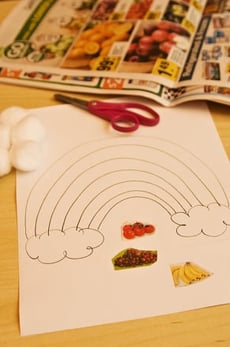
Create a Rainbow of Healthy Food
Activity
Create a Rainbow of Healthy Food
Pre-K
Data and Graphing
Help your preschooler chart her good eating habits with this arts and crafts activity that has her making a healthy fruits and vegetables rainbow and graph!
Activity
Create a Rainbow of Healthy Food
Activity
Create a Rainbow of Healthy Food
Help your preschooler chart her good eating habits with this arts and crafts activity that has her making a healthy fruits and vegetables rainbow and graph!
Pre-K
Data and Graphing
Activity
Let's Graph Our Fall Favorites!
Lesson Plan
Let's Graph Our Fall Favorites!
Second Grade
Data and Graphing
This engaging math lesson combines all of your kid's fall favorites as they learn to represent data using a bar graph.
Lesson Plan
Let's Graph Our Fall Favorites!
Lesson Plan
Let's Graph Our Fall Favorites!
This engaging math lesson combines all of your kid's fall favorites as they learn to represent data using a bar graph.
Second Grade
Data and Graphing
Lesson Plan
1