SKIP TO CONTENT
Worksheet Generator
Subjects
Grades
Worksheets
Games
Build a Worksheet
More Resources
Roly Recommends
Subjects
Grades
Worksheets
Games
Build a Worksheet
More Resources
Roly Recommends
All Subjects
Math
Data and Graphing
Subtopics:
Collecting and Organizing Data
Picture Graphs
Bar Graphs
✕
Line Plots
Coordinate Plane
Show Less
Filters
Search for: how, when, and, where, 2
✕
Math
✕
1st - 5th Grade
✕
Subjects
Math
English Language Arts
Science
Social Studies
Foreign Language
Grade Level
Pre-K
K
1st
2nd
3rd
4th
5th
6th
7th
8th
Early Childhood
Elementary School
Middle School
Resource Type
Worksheets
Games
Lesson Plans
Interactive Worksheets
Activities
Exercises
Offline Games
Guided Lessons
Occasion
Birthdays
Summer
Back to School
Halloween
Holidays
Hanukkah
Common Core
Yes
Game Type
Ball Games
English Language Support
Yes
See More
Clear All
View 47 results
Showing Results for how when and where 2
47 results
Search for: how, when, and, where, 2
✕
Math
✕
1st - 5th Grade
✕
Clear All
Sort by:
Relevance
Most recent
Most popular
Alphabetical A-Z
Alphabetical Z-A
All filters
47 results
Sort by:
Relevance
Most recent
Most popular
Alphabetical A-Z
Alphabetical Z-A
Measurement and Data 2
Guided Lesson
Measurement and Data 2
First Grade
Measurement
Measurement and data in first grade includes such important concepts as comparing the length and weight of two objects using a third object. This guided lesson, designed by curriculum experts, takes students on an exploration of these measurement and data concepts. Once through with the lesson, kids can gain extra practice with measurement and data with the accompanying worksheets.
Guided Lesson
Measurement and Data 2
Guided Lesson
Measurement and Data 2
Measurement and data in first grade includes such important concepts as comparing the length and weight of two objects using a third object. This guided lesson, designed by curriculum experts, takes students on an exploration of these measurement and data concepts. Once through with the lesson, kids can gain extra practice with measurement and data with the accompanying worksheets.
First Grade
Measurement
Guided Lesson
How to Make a Bar Graph with BBQ Food
Worksheet
How to Make a Bar Graph with BBQ Food
Second Grade
Data and Graphing
Great food never goes out of style. Find out what the most popular barbecue foods are with this bar graph that teaches kids how to interpret data.
Worksheet
How to Make a Bar Graph with BBQ Food
Worksheet
How to Make a Bar Graph with BBQ Food
Great food never goes out of style. Find out what the most popular barbecue foods are with this bar graph that teaches kids how to interpret data.
Second Grade
Data and Graphing
Worksheet
Measurement and Data 4
Guided Lesson
Measurement and Data 4
Fourth Grade
Fractions
Representing data on graphs makes math visual and involves some creativity and design. Plotting data using fractional units takes their learning one step further. Also in this unit, students learn to measure using both traditional units (like inches, feet and yards) and metric units, and how to convert measurements within each system. The concept of measurement gets two dimensional when students explore measuring and working with angles.
Guided Lesson
Measurement and Data 4
Guided Lesson
Measurement and Data 4
Representing data on graphs makes math visual and involves some creativity and design. Plotting data using fractional units takes their learning one step further. Also in this unit, students learn to measure using both traditional units (like inches, feet and yards) and metric units, and how to convert measurements within each system. The concept of measurement gets two dimensional when students explore measuring and working with angles.
Fourth Grade
Fractions
Guided Lesson
Data 2
Guided Lesson
Data 2
Fifth Grade
Fractions
Understanding data and graphs is a critical skill that we use on a regular basis to read news articles, reports and other media to interpret information. In this unit, students investigate data collection, data organization and visual representation in different kinds of graphics (i.e. line plots, pie charts). Learners also apply concepts of probability and statistics to analyze data.
Guided Lesson
Data 2
Guided Lesson
Data 2
Understanding data and graphs is a critical skill that we use on a regular basis to read news articles, reports and other media to interpret information. In this unit, students investigate data collection, data organization and visual representation in different kinds of graphics (i.e. line plots, pie charts). Learners also apply concepts of probability and statistics to analyze data.
Fifth Grade
Fractions
Guided Lesson
Mayflower Math
Activity
Mayflower Math
Fifth Grade
Data and Graphing
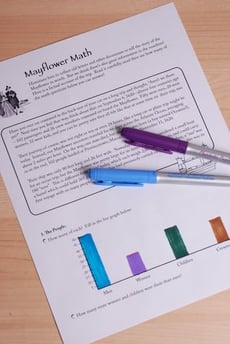
When you're studying the Mayflower, numbers can be an important part of the history...and a great chance to practice elementary math!
Activity
Mayflower Math
Activity
Mayflower Math
When you're studying the Mayflower, numbers can be an important part of the history...and a great chance to practice elementary math!
Fifth Grade
Data and Graphing
Activity
Ice Cream Bar Graph #2
Worksheet
Ice Cream Bar Graph #2
First Grade
Data and Graphing
Help keep track of ice cream sales with some bar graph practice! Your child will have a scoop full of fun figuring out which friend sold the most ice cream.
Worksheet
Ice Cream Bar Graph #2
Worksheet
Ice Cream Bar Graph #2
Help keep track of ice cream sales with some bar graph practice! Your child will have a scoop full of fun figuring out which friend sold the most ice cream.
First Grade
Data and Graphing
Worksheet
Scaled Bar Graphs
Exercise
Scaled Bar Graphs
Third Grade
Data and Graphing
This exercise will clarify just how scaled bar graphs represent data found in math problems.
Exercise
Scaled Bar Graphs
Exercise
Scaled Bar Graphs
This exercise will clarify just how scaled bar graphs represent data found in math problems.
Third Grade
Data and Graphing
Exercise
Graph Basics: Line Graphs
Worksheet
Graph Basics: Line Graphs
Third Grade
Data and Graphing
Learn how to read, analyze, and create a line graph with this helpful math worksheet!
Worksheet
Graph Basics: Line Graphs
Worksheet
Graph Basics: Line Graphs
Learn how to read, analyze, and create a line graph with this helpful math worksheet!
Third Grade
Data and Graphing
Worksheet
Jake's Nature Hike
Worksheet
Jake's Nature Hike
Second Grade
Data and Graphing
How many animals have you seen on your hikes? Jake saw many animals on his! Create your own bar graph with the information given.
Worksheet
Jake's Nature Hike
Worksheet
Jake's Nature Hike
How many animals have you seen on your hikes? Jake saw many animals on his! Create your own bar graph with the information given.
Second Grade
Data and Graphing
Worksheet
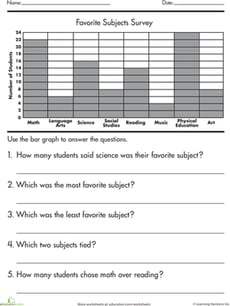
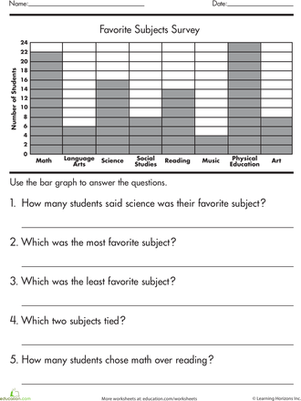
Graphing Survey Data
Worksheet
Graphing Survey Data
Second Grade
Data and Graphing
If your second grader is stumped by bar graphs, clear up the confusion with this worksheet that helps kids learn how to read and interpret a bar graph.
Worksheet
Graphing Survey Data
Worksheet
Graphing Survey Data
If your second grader is stumped by bar graphs, clear up the confusion with this worksheet that helps kids learn how to read and interpret a bar graph.
Second Grade
Data and Graphing
Worksheet
Ice Cream Bar Graph #9
Worksheet
Ice Cream Bar Graph #9
First Grade
Data and Graphing
Sam, Kate, and Becky have just had a long day of selling ice cream cones, and they want to know how many were sold. Help them with this pictograph worksheet.
Worksheet
Ice Cream Bar Graph #9
Worksheet
Ice Cream Bar Graph #9
Sam, Kate, and Becky have just had a long day of selling ice cream cones, and they want to know how many were sold. Help them with this pictograph worksheet.
First Grade
Data and Graphing
Worksheet
Graph My Design
Worksheet
Graph My Design
First Grade
Data and Graphing
Students build a design and then use this bar graph to show how many of each shape was used. Place inside a sheet protector to reuse.
Worksheet
Graph My Design
Worksheet
Graph My Design
Students build a design and then use this bar graph to show how many of each shape was used. Place inside a sheet protector to reuse.
First Grade
Data and Graphing
Worksheet
Graph Practice
Interactive Worksheet
Graph Practice
Second Grade
Data and Graphing
Don't let your second grader forget graphs! Be sure to review how to read a bar graph and pictograph with help from this handy worksheet. Challenge your young mathematician to read the graphs and answer some questions.
Interactive Worksheet
Graph Practice
Interactive Worksheet
Graph Practice
Don't let your second grader forget graphs! Be sure to review how to read a bar graph and pictograph with help from this handy worksheet. Challenge your young mathematician to read the graphs and answer some questions.
Second Grade
Data and Graphing
Interactive Worksheet
Data 1
Guided Lesson
Data 1
Third Grade
Fractions
Learning how to represent numerical information is a key part of the third grade math curriculum. This lesson in data provides guided instruction designed by our team of curriculum experts and teachers to present this concept in an engaging way. Not only that, but helpful exercises help kids to see the practical applicaton of these skills in the real world.
Guided Lesson
Data 1
Guided Lesson
Data 1
Learning how to represent numerical information is a key part of the third grade math curriculum. This lesson in data provides guided instruction designed by our team of curriculum experts and teachers to present this concept in an engaging way. Not only that, but helpful exercises help kids to see the practical applicaton of these skills in the real world.
Third Grade
Fractions
Guided Lesson
Draw a Birthday Bar Graph
Activity
Draw a Birthday Bar Graph
Third Grade
Data and Graphing
Liven up a lesson about graphing by helping your third grader compile a bar graph from his classmates' birthday data.
Activity
Draw a Birthday Bar Graph
Activity
Draw a Birthday Bar Graph
Liven up a lesson about graphing by helping your third grader compile a bar graph from his classmates' birthday data.
Third Grade
Data and Graphing
Activity
Study of Names
Activity
Study of Names
Third Grade
Data and Graphing
Graph are a great way to organize information. Your child will get to practice graphing by creating a bar graph and a pictorial graph of her friend's names.
Activity
Study of Names
Activity
Study of Names
Graph are a great way to organize information. Your child will get to practice graphing by creating a bar graph and a pictorial graph of her friend's names.
Third Grade
Data and Graphing
Activity
Graphing Colored Counters
Lesson Plan
Graphing Colored Counters
Kindergarten
Data and Graphing
In this lesson, your students will use the background knowledge that they have about counting and sorting to graph data. They will practice answering questions about the graph!
Lesson Plan
Graphing Colored Counters
Lesson Plan
Graphing Colored Counters
In this lesson, your students will use the background knowledge that they have about counting and sorting to graph data. They will practice answering questions about the graph!
Kindergarten
Data and Graphing
Lesson Plan
Create a Family Graph!
Activity
Create a Family Graph!
Third Grade
Data and Graphing
Create a graph based on the interests of family member's to see who has what in common. Your child will practice her math skills and get to know the family!
Activity
Create a Family Graph!
Activity
Create a Family Graph!
Create a graph based on the interests of family member's to see who has what in common. Your child will practice her math skills and get to know the family!
Third Grade
Data and Graphing
Activity
Learn to Graph with a Backyard Tournament
Activity
Learn to Graph with a Backyard Tournament
First Grade
Data and Graphing
Gather the neighborhood children together and practice graphing with this backyard tournament!
Activity
Learn to Graph with a Backyard Tournament
Activity
Learn to Graph with a Backyard Tournament
Gather the neighborhood children together and practice graphing with this backyard tournament!
First Grade
Data and Graphing
Activity
Track the Weather with Weather Charts
Activity
Track the Weather with Weather Charts
Third Grade
Measurement
Learn about the microclimate of your backyard by tracking rainfall, temperature, and observed weather with hand drawn charts and graphs.
Activity
Track the Weather with Weather Charts
Activity
Track the Weather with Weather Charts
Learn about the microclimate of your backyard by tracking rainfall, temperature, and observed weather with hand drawn charts and graphs.
Third Grade
Measurement
Activity
Do We Wear the Same Colors?
Activity
Do We Wear the Same Colors?
Third Grade
Data and Graphing
Hone observational skills and introduce the basics of data interpretation with this data gathering activity all about the different colors people wear.
Activity
Do We Wear the Same Colors?
Activity
Do We Wear the Same Colors?
Hone observational skills and introduce the basics of data interpretation with this data gathering activity all about the different colors people wear.
Third Grade
Data and Graphing
Activity
Summer Bar Graph
Activity
Summer Bar Graph
First Grade
Data and Graphing
Draw some educational value out of a summer stocked full of adventures!
Activity
Summer Bar Graph
Activity
Summer Bar Graph
Draw some educational value out of a summer stocked full of adventures!
First Grade
Data and Graphing
Activity
Graph Money
Activity
Graph Money
Second Grade
Data and Graphing
Give your smart second grader a rich challenge with this activity that combines graphing practice with money!
Activity
Graph Money
Activity
Graph Money
Give your smart second grader a rich challenge with this activity that combines graphing practice with money!
Second Grade
Data and Graphing
Activity
Why Do Leaves Change Color?
Activity
Why Do Leaves Change Color?
Second Grade
Data and Graphing
Engage your children with this fun fall activity that integrates math and science. First, your child will excavate to find leaves. Next, they'll examine them to determine the colors. Then, your child will graph their findings.
Activity
Why Do Leaves Change Color?
Activity
Why Do Leaves Change Color?
Engage your children with this fun fall activity that integrates math and science. First, your child will excavate to find leaves. Next, they'll examine them to determine the colors. Then, your child will graph their findings.
Second Grade
Data and Graphing
Activity
Sweet Sorting: A Fun Activity to Practice Categorizing
Activity
Sweet Sorting: A Fun Activity to Practice Categorizing
Third Grade
Data and Graphing
Delay your child's sugar overload, and develop his critical thinking skills, by doing some "sweet sorting" of his Halloween treasures!
Activity
Sweet Sorting: A Fun Activity to Practice Categorizing
Activity
Sweet Sorting: A Fun Activity to Practice Categorizing
Delay your child's sugar overload, and develop his critical thinking skills, by doing some "sweet sorting" of his Halloween treasures!
Third Grade
Data and Graphing
Activity
Bar Graphing with Roly
Game
Bar Graphing with Roly
Second Grade
Data and Graphing
Stop those germs! Kids must catch germs as they drop and prevent people from getting sick in this icky data and graphing game.
Game
Bar Graphing with Roly
Game
Bar Graphing with Roly
Stop those germs! Kids must catch germs as they drop and prevent people from getting sick in this icky data and graphing game.
Second Grade
Data and Graphing
Game
Bar Graph: Getting to School
Worksheet
Bar Graph: Getting to School
Third Grade
Data and Graphing
Kids completing this third grade math worksheet use a bar graph to compare data about transportation to school and solve addition and subtraction problems.
Worksheet
Bar Graph: Getting to School
Worksheet
Bar Graph: Getting to School
Kids completing this third grade math worksheet use a bar graph to compare data about transportation to school and solve addition and subtraction problems.
Third Grade
Data and Graphing
Worksheet
Zap and Kreb: Graphing Word Problems
Game
Zap and Kreb: Graphing Word Problems
Third Grade
Data and Graphing
Kids journey to Earth with aliens Zap and Kreb on a mission to gather data and create graphs in a math story that's out of this world!
Game
Zap and Kreb: Graphing Word Problems
Game
Zap and Kreb: Graphing Word Problems
Kids journey to Earth with aliens Zap and Kreb on a mission to gather data and create graphs in a math story that's out of this world!
Third Grade
Data and Graphing
Game
Beginning Bar Graphs: Favorite Cake
Worksheet
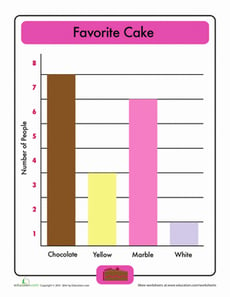
Beginning Bar Graphs: Favorite Cake
First Grade
Data and Graphing
This favorite cake bar graph makes reading bar graphs simple for kids to understand.
Worksheet
Beginning Bar Graphs: Favorite Cake
Worksheet
Beginning Bar Graphs: Favorite Cake
This favorite cake bar graph makes reading bar graphs simple for kids to understand.
First Grade
Data and Graphing
Worksheet
Backyard Bugs
Activity
Backyard Bugs
First Grade
Data and Graphing
Want to boost math and science learning? Take a bug expedition and give your first grader practice observing and charting what they see.
Activity
Backyard Bugs
Activity
Backyard Bugs
Want to boost math and science learning? Take a bug expedition and give your first grader practice observing and charting what they see.
First Grade
Data and Graphing
Activity
1
2