SKIP TO CONTENT
Worksheet Generator
Subjects
Grades
Worksheets
Games
Build a Worksheet
More Resources
Roly Recommends
Subjects
Grades
Worksheets
Games
Build a Worksheet
More Resources
Roly Recommends
All Subjects
Math
Data and Graphing
Subtopics:
Collecting and Organizing Data
Picture Graphs
Bar Graphs
Line Plots
Coordinate Plane
Show Less
Filters
Search for: to, change, an, adjectiveadverb, 2
✕
Math
✕
1st - 5th Grade
✕
Subjects
Math
English Language Arts
Science
Social Studies
Foreign Language
Grade Level
Pre-K
K
1st
2nd
3rd
4th
5th
6th
7th
8th
Early Childhood
Elementary School
Middle School
Resource Type
Worksheets
Games
Lesson Plans
Interactive Worksheets
Activities
Exercises
Offline Games
Guided Lessons
Teacher Resources
Occasion
Birthdays
St. Patrick's Day
Summer
Independence Day
Halloween
Winter
Holidays
Common Core
Yes
Game Type
Ball Games
Arts & Crafts
Arts & Crafts
Paper & Glue Crafts
English Language Support
Yes
See More
Clear All
View 63 results
Showing Results for to change an adjectiveadverb 2
63 results
Search for: to, change, an, adjectiveadverb, 2
✕
Math
✕
1st - 5th Grade
✕
Clear All
Sort by:
Relevance
Most recent
Most popular
Alphabetical A-Z
Alphabetical Z-A
All filters
63 results
Sort by:
Relevance
Most recent
Most popular
Alphabetical A-Z
Alphabetical Z-A
Why Do Leaves Change Color?
Activity
Why Do Leaves Change Color?
Second Grade
Data and Graphing
Engage your children with this fun fall activity that integrates math and science. First, your child will excavate to find leaves. Next, they'll examine them to determine the colors. Then, your child will graph their findings.
Activity
Why Do Leaves Change Color?
Activity
Why Do Leaves Change Color?
Engage your children with this fun fall activity that integrates math and science. First, your child will excavate to find leaves. Next, they'll examine them to determine the colors. Then, your child will graph their findings.
Second Grade
Data and Graphing
Activity
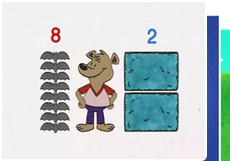
Using Base 10 Drawings in Two-Digit Addition
Worksheet
Using Base 10 Drawings in Two-Digit Addition
Second Grade
Addition
This worksheet teaches you to use base 10 drawings to add two-digit numbers.
Worksheet
Using Base 10 Drawings in Two-Digit Addition
Worksheet
Using Base 10 Drawings in Two-Digit Addition
This worksheet teaches you to use base 10 drawings to add two-digit numbers.
Second Grade
Addition
Worksheet
Measurement and Data 2
Guided Lesson
Measurement and Data 2
First Grade
Measurement
Measurement and data in first grade includes such important concepts as comparing the length and weight of two objects using a third object. This guided lesson, designed by curriculum experts, takes students on an exploration of these measurement and data concepts. Once through with the lesson, kids can gain extra practice with measurement and data with the accompanying worksheets.
Guided Lesson
Measurement and Data 2
Guided Lesson
Measurement and Data 2
Measurement and data in first grade includes such important concepts as comparing the length and weight of two objects using a third object. This guided lesson, designed by curriculum experts, takes students on an exploration of these measurement and data concepts. Once through with the lesson, kids can gain extra practice with measurement and data with the accompanying worksheets.
First Grade
Measurement
Guided Lesson
Data 2
Guided Lesson
Data 2
Fifth Grade
Fractions
Understanding data and graphs is a critical skill that we use on a regular basis to read news articles, reports and other media to interpret information. In this unit, students investigate data collection, data organization and visual representation in different kinds of graphics (i.e. line plots, pie charts). Learners also apply concepts of probability and statistics to analyze data.
Guided Lesson
Data 2
Guided Lesson
Data 2
Understanding data and graphs is a critical skill that we use on a regular basis to read news articles, reports and other media to interpret information. In this unit, students investigate data collection, data organization and visual representation in different kinds of graphics (i.e. line plots, pie charts). Learners also apply concepts of probability and statistics to analyze data.
Fifth Grade
Fractions
Guided Lesson
Probability Darts 2
Worksheet
Probability Darts 2
Fifth Grade
Data and Graphing
Build on fraction math skills and working with degrees to get probability practice for your middle schooler with this math worksheet series.
Worksheet
Probability Darts 2
Worksheet
Probability Darts 2
Build on fraction math skills and working with degrees to get probability practice for your middle schooler with this math worksheet series.
Fifth Grade
Data and Graphing
Worksheet
Probability Toss 2
Worksheet
Probability Toss 2
Fifth Grade
Data and Graphing
Boost your child's math know-how! What are the odds a dart would land on one of the given sections of this circle?
Worksheet
Probability Toss 2
Worksheet
Probability Toss 2
Boost your child's math know-how! What are the odds a dart would land on one of the given sections of this circle?
Fifth Grade
Data and Graphing
Worksheet
Probability and Statistics 2
Exercise
Probability and Statistics 2
Fourth Grade
Data and Graphing
Continue the probability and statistics fun with this involving exercise that shows students how to use data to make predictions.
Exercise
Probability and Statistics 2
Exercise
Probability and Statistics 2
Continue the probability and statistics fun with this involving exercise that shows students how to use data to make predictions.
Fourth Grade
Data and Graphing
Exercise
Olympic Probability: Archery #2
Worksheet
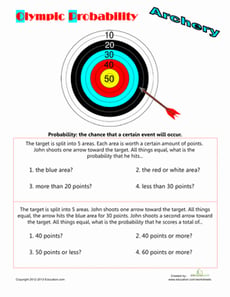
Olympic Probability: Archery #2
Fifth Grade
Data and Graphing
Hit your target with probability! Your student can practice probability the Olympic way, with this archery-themed math sheet.
Worksheet
Olympic Probability: Archery #2
Worksheet
Olympic Probability: Archery #2
Hit your target with probability! Your student can practice probability the Olympic way, with this archery-themed math sheet.
Fifth Grade
Data and Graphing
Worksheet
Birdie Graph Paper
Worksheet
Birdie Graph Paper
Fifth Grade
Data and Graphing
This blank graph paper is pretty in pink and features two adorable birds for a border.
Worksheet
Birdie Graph Paper
Worksheet
Birdie Graph Paper
This blank graph paper is pretty in pink and features two adorable birds for a border.
Fifth Grade
Data and Graphing
Worksheet
Collecting and Organizing Data 2
Exercise
Collecting and Organizing Data 2
Fourth Grade
Data and Graphing
Your students will grow adept at collecting and organizing data around them with this engaging exercise.
Exercise
Collecting and Organizing Data 2
Exercise
Collecting and Organizing Data 2
Your students will grow adept at collecting and organizing data around them with this engaging exercise.
Fourth Grade
Data and Graphing
Exercise
Mystery Picture Graph: Night Scene
Worksheet
Mystery Picture Graph: Night Scene
Fifth Grade
Geometry
Plot the coordinates on the grid to reveal a mystery picture in this two-page graphing worksheet!
Worksheet
Mystery Picture Graph: Night Scene
Worksheet
Mystery Picture Graph: Night Scene
Plot the coordinates on the grid to reveal a mystery picture in this two-page graphing worksheet!
Fifth Grade
Geometry
Worksheet
Ice Cream Bar Graph #2
Worksheet
Ice Cream Bar Graph #2
First Grade
Data and Graphing
Help keep track of ice cream sales with some bar graph practice! Your child will have a scoop full of fun figuring out which friend sold the most ice cream.
Worksheet
Ice Cream Bar Graph #2
Worksheet
Ice Cream Bar Graph #2
Help keep track of ice cream sales with some bar graph practice! Your child will have a scoop full of fun figuring out which friend sold the most ice cream.
First Grade
Data and Graphing
Worksheet
Sort 2D and 3D Shapes
Interactive Worksheet
Sort 2D and 3D Shapes
Kindergarten
Geometry
Can your kid tell the difference between 2-dimensional and 3-dimensional shapes? Kindergarten is a good time to start!
Interactive Worksheet
Sort 2D and 3D Shapes
Interactive Worksheet
Sort 2D and 3D Shapes
Can your kid tell the difference between 2-dimensional and 3-dimensional shapes? Kindergarten is a good time to start!
Kindergarten
Geometry
Interactive Worksheet
Comparing Pictographs: Taxi, Taxi
Worksheet
Comparing Pictographs: Taxi, Taxi
Third Grade
Addition
In this 3rd grade math worksheet, kids analyze and compare data in two pictographs in order to answer a set of word problems.
Worksheet
Comparing Pictographs: Taxi, Taxi
Worksheet
Comparing Pictographs: Taxi, Taxi
In this 3rd grade math worksheet, kids analyze and compare data in two pictographs in order to answer a set of word problems.
Third Grade
Addition
Worksheet
Comparing Pictographs: Football Time
Worksheet
Comparing Pictographs: Football Time
Third Grade
Data and Graphing
In this math worksheet, kids compare two pictographs that record the number of footballs kicked and the number of footballs thrown on the field.
Worksheet
Comparing Pictographs: Football Time
Worksheet
Comparing Pictographs: Football Time
In this math worksheet, kids compare two pictographs that record the number of footballs kicked and the number of footballs thrown on the field.
Third Grade
Data and Graphing
Worksheet
Lemonade Stand Pictograph
Worksheet
Lemonade Stand Pictograph
Second Grade
Data and Graphing
See how Susie's lemonade stand is doing! Students will learn how to analyze and compare data by answering questions based on the two pictographs.
Worksheet
Lemonade Stand Pictograph
Worksheet
Lemonade Stand Pictograph
See how Susie's lemonade stand is doing! Students will learn how to analyze and compare data by answering questions based on the two pictographs.
Second Grade
Data and Graphing
Worksheet
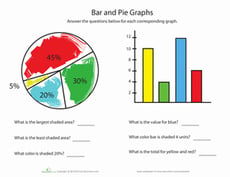
Different Types of Graphs: Picture and Bar Graphs
Worksheet
Different Types of Graphs: Picture and Bar Graphs
First Grade
Data and Graphing
Sure to test your kid's graphing skills, this graph worksheet features two different types of graphs and questions to go along with them.
Worksheet
Different Types of Graphs: Picture and Bar Graphs
Worksheet
Different Types of Graphs: Picture and Bar Graphs
Sure to test your kid's graphing skills, this graph worksheet features two different types of graphs and questions to go along with them.
First Grade
Data and Graphing
Worksheet
Comparing Pictographs: Tulips and Daisies
Worksheet
Comparing Pictographs: Tulips and Daisies
Second Grade
Data and Graphing
Your child will use the data in two pictographs that show the number of tulips and daisies imported from certain European countries to answer word problems.
Worksheet
Comparing Pictographs: Tulips and Daisies
Worksheet
Comparing Pictographs: Tulips and Daisies
Your child will use the data in two pictographs that show the number of tulips and daisies imported from certain European countries to answer word problems.
Second Grade
Data and Graphing
Worksheet
Practice Reading Venn Diagrams #2: In the Orchestra
Worksheet
Practice Reading Venn Diagrams #2: In the Orchestra
Second Grade
Data and Graphing
Kids practice reading a Venn diagram about instruments in an orchestra and answering questions about it in this 2nd grade math worksheet.
Worksheet
Practice Reading Venn Diagrams #2: In the Orchestra
Worksheet
Practice Reading Venn Diagrams #2: In the Orchestra
Kids practice reading a Venn diagram about instruments in an orchestra and answering questions about it in this 2nd grade math worksheet.
Second Grade
Data and Graphing
Worksheet
Geometry 7
Guided Lesson
Geometry 7
Fifth Grade
Geometry
This geometry unit engages students in analytical thinking as they learn about the properties of two dimensional figures and consider the different ways they can be sorted based on those properties. Students also learn to plot points, lines and shapes on a coordinate graph.
Guided Lesson
Geometry 7
Guided Lesson
Geometry 7
This geometry unit engages students in analytical thinking as they learn about the properties of two dimensional figures and consider the different ways they can be sorted based on those properties. Students also learn to plot points, lines and shapes on a coordinate graph.
Fifth Grade
Geometry
Guided Lesson
Measurement and Data 4
Guided Lesson
Measurement and Data 4
Fourth Grade
Fractions
Representing data on graphs makes math visual and involves some creativity and design. Plotting data using fractional units takes their learning one step further. Also in this unit, students learn to measure using both traditional units (like inches, feet and yards) and metric units, and how to convert measurements within each system. The concept of measurement gets two dimensional when students explore measuring and working with angles.
Guided Lesson
Measurement and Data 4
Guided Lesson
Measurement and Data 4
Representing data on graphs makes math visual and involves some creativity and design. Plotting data using fractional units takes their learning one step further. Also in this unit, students learn to measure using both traditional units (like inches, feet and yards) and metric units, and how to convert measurements within each system. The concept of measurement gets two dimensional when students explore measuring and working with angles.
Fourth Grade
Fractions
Guided Lesson
Winter Temperatures
Worksheet
Winter Temperatures
Fourth Grade
Measurement
Your meteorologist in the making will investigate changes in temperature as she practices charting and graphing data.
Worksheet
Winter Temperatures
Worksheet
Winter Temperatures
Your meteorologist in the making will investigate changes in temperature as she practices charting and graphing data.
Fourth Grade
Measurement
Worksheet
Pitch and Hit Data
Activity
Pitch and Hit Data
Third Grade
Data and Graphing
Okay, engaging in a graphing activity may sound ho-hum, but if you use fun data, it changes the picture entirely.
Activity
Pitch and Hit Data
Activity
Pitch and Hit Data
Okay, engaging in a graphing activity may sound ho-hum, but if you use fun data, it changes the picture entirely.
Third Grade
Data and Graphing
Activity
Graph Money
Activity
Graph Money
Second Grade
Data and Graphing
Give your smart second grader a rich challenge with this activity that combines graphing practice with money!
Activity
Graph Money
Activity
Graph Money
Give your smart second grader a rich challenge with this activity that combines graphing practice with money!
Second Grade
Data and Graphing
Activity
Graph Basics: Line Graphs
Worksheet
Graph Basics: Line Graphs
Third Grade
Data and Graphing
Learn how to read, analyze, and create a line graph with this helpful math worksheet!
Worksheet
Graph Basics: Line Graphs
Worksheet
Graph Basics: Line Graphs
Learn how to read, analyze, and create a line graph with this helpful math worksheet!
Third Grade
Data and Graphing
Worksheet
Probability Dice Game
Activity
Probability Dice Game
Fifth Grade
Data and Graphing
Check out this dice game perfect for teaching your savvy kid the fundamentals of probability.
Activity
Probability Dice Game
Activity
Probability Dice Game
Check out this dice game perfect for teaching your savvy kid the fundamentals of probability.
Fifth Grade
Data and Graphing
Activity
Dice Probability
Activity
Dice Probability
Fourth Grade
Data and Graphing
Analyze this simple betting game with your fourth grade student in order to discuss probability.
Activity
Dice Probability
Activity
Dice Probability
Analyze this simple betting game with your fourth grade student in order to discuss probability.
Fourth Grade
Data and Graphing
Activity
Less Than or Greater Than: 1 to 20
Game
Less Than or Greater Than: 1 to 20
First Grade
Numbers and Counting
The alligators are hungry for numbers, and kids use number skills to feed them.
Game
Less Than or Greater Than: 1 to 20
Game
Less Than or Greater Than: 1 to 20
The alligators are hungry for numbers, and kids use number skills to feed them.
First Grade
Numbers and Counting
Game
Solve a Graph Puzzle
Activity
Solve a Graph Puzzle
Fifth Grade
Data and Graphing
Here's a fun, geometric puzzle activity that will capture your child's interest and strengthen his number awareness and graphing skills.
Activity
Solve a Graph Puzzle
Activity
Solve a Graph Puzzle
Here's a fun, geometric puzzle activity that will capture your child's interest and strengthen his number awareness and graphing skills.
Fifth Grade
Data and Graphing
Activity
What is it Telling Me? Creating and Interpreting Line Plots
Lesson Plan
What is it Telling Me? Creating and Interpreting Line Plots
Third Grade
Data and Graphing
Line plots are a great way to introduce your students to graphing data. In this lesson, your students will learn how to create a line plot and also practice interpreting line plots.
Lesson Plan
What is it Telling Me? Creating and Interpreting Line Plots
Lesson Plan
What is it Telling Me? Creating and Interpreting Line Plots
Line plots are a great way to introduce your students to graphing data. In this lesson, your students will learn how to create a line plot and also practice interpreting line plots.
Third Grade
Data and Graphing
Lesson Plan
1
2
3