SKIP TO CONTENT
Worksheet Generator
Subjects
Grades
Worksheets
Games
Build a Worksheet
More Resources
Roly Recommends
Subjects
Grades
Worksheets
Games
Build a Worksheet
More Resources
Roly Recommends
All Subjects
Math
Data and Graphing
Subtopics:
Collecting and Organizing Data
Picture Graphs
Bar Graphs
Line Plots
Coordinate Plane
Show Less
Filters
Search for: compare, with, different, denominators, 1
✕
Math
✕
1st - 5th Grade
✕
Subjects
Math
English Language Arts
Science
Social Studies
Foreign Language
Grade Level
Pre-K
K
1st
2nd
3rd
4th
5th
6th
7th
8th
Early Childhood
Elementary School
Middle School
Resource Type
Worksheets
Games
Lesson Plans
Workbooks
Activities
Exercises
Offline Games
Guided Lessons
Occasion
Birthdays
St. Patrick's Day
Summer
Independence Day
Back to School
Halloween
Holidays
Hanukkah
Valentine's Day
Common Core
Yes
Game Type
Ball Games
Arts & Crafts
Arts & Crafts
Paper & Glue Crafts
English Language Support
Yes
See More
Clear All
View 109 results
Showing Results for compare with different denominators 1
109 results
Search for: compare, with, different, denominators, 1
✕
Math
✕
1st - 5th Grade
✕
Clear All
Sort by:
Relevance
Most recent
Most popular
Alphabetical A-Z
Alphabetical Z-A
All filters
109 results
Sort by:
Relevance
Most recent
Most popular
Alphabetical A-Z
Alphabetical Z-A
Different Types of Graphs: Picture and Bar Graphs
Worksheet
Different Types of Graphs: Picture and Bar Graphs
First Grade
Data and Graphing
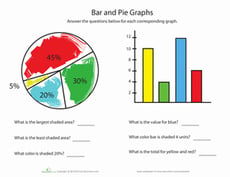
Sure to test your kid's graphing skills, this graph worksheet features two different types of graphs and questions to go along with them.
Worksheet
Different Types of Graphs: Picture and Bar Graphs
Worksheet
Different Types of Graphs: Picture and Bar Graphs
Sure to test your kid's graphing skills, this graph worksheet features two different types of graphs and questions to go along with them.
First Grade
Data and Graphing
Worksheet
Probability Darts 1
Worksheet
Probability Darts 1
Fifth Grade
Data and Graphing
Kids will practice with fractions and degrees in this probability worksheet. Help your kid figure out the probability of a dart landing in different places.
Worksheet
Probability Darts 1
Worksheet
Probability Darts 1
Kids will practice with fractions and degrees in this probability worksheet. Help your kid figure out the probability of a dart landing in different places.
Fifth Grade
Data and Graphing
Worksheet
Comparing Pictographs: Taxi, Taxi
Worksheet
Comparing Pictographs: Taxi, Taxi
Third Grade
Addition
In this 3rd grade math worksheet, kids analyze and compare data in two pictographs in order to answer a set of word problems.
Worksheet
Comparing Pictographs: Taxi, Taxi
Worksheet
Comparing Pictographs: Taxi, Taxi
In this 3rd grade math worksheet, kids analyze and compare data in two pictographs in order to answer a set of word problems.
Third Grade
Addition
Worksheet
Comparing Pictographs: Football Time
Worksheet
Comparing Pictographs: Football Time
Third Grade
Data and Graphing
In this math worksheet, kids compare two pictographs that record the number of footballs kicked and the number of footballs thrown on the field.
Worksheet
Comparing Pictographs: Football Time
Worksheet
Comparing Pictographs: Football Time
In this math worksheet, kids compare two pictographs that record the number of footballs kicked and the number of footballs thrown on the field.
Third Grade
Data and Graphing
Worksheet
Comparing Sets of Data
Worksheet
Comparing Sets of Data
Second Grade
Data and Graphing
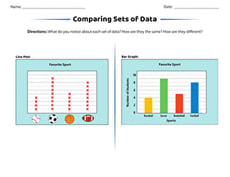
Want to help your students begin to think critically about data? Laminate and display this worksheet to spark discussion about different ways to represent data.
Worksheet
Comparing Sets of Data
Worksheet
Comparing Sets of Data
Want to help your students begin to think critically about data? Laminate and display this worksheet to spark discussion about different ways to represent data.
Second Grade
Data and Graphing
Worksheet
Using a Chart: Do Your Chores!
Worksheet
Using a Chart: Do Your Chores!
Third Grade
Data and Graphing
Kids completing this third grade math worksheet use a chart to compare data and solve addition problems.
Worksheet
Using a Chart: Do Your Chores!
Worksheet
Using a Chart: Do Your Chores!
Kids completing this third grade math worksheet use a chart to compare data and solve addition problems.
Third Grade
Data and Graphing
Worksheet
Data 1
Guided Lesson
Data 1
Third Grade
Fractions
Learning how to represent numerical information is a key part of the third grade math curriculum. This lesson in data provides guided instruction designed by our team of curriculum experts and teachers to present this concept in an engaging way. Not only that, but helpful exercises help kids to see the practical applicaton of these skills in the real world.
Guided Lesson
Data 1
Guided Lesson
Data 1
Learning how to represent numerical information is a key part of the third grade math curriculum. This lesson in data provides guided instruction designed by our team of curriculum experts and teachers to present this concept in an engaging way. Not only that, but helpful exercises help kids to see the practical applicaton of these skills in the real world.
Third Grade
Fractions
Guided Lesson
Lemonade Stand Pictograph
Worksheet
Lemonade Stand Pictograph
Second Grade
Data and Graphing
See how Susie's lemonade stand is doing! Students will learn how to analyze and compare data by answering questions based on the two pictographs.
Worksheet
Lemonade Stand Pictograph
Worksheet
Lemonade Stand Pictograph
See how Susie's lemonade stand is doing! Students will learn how to analyze and compare data by answering questions based on the two pictographs.
Second Grade
Data and Graphing
Worksheet
Pictograph Practice: Hamburger Cafe
Worksheet
Pictograph Practice: Hamburger Cafe
Second Grade
Data and Graphing
Pictographs are a great introduction to working with data and graphs. Kids help the hamburger cafe compare the number of hamburgers they sold using pictographs.
Worksheet
Pictograph Practice: Hamburger Cafe
Worksheet
Pictograph Practice: Hamburger Cafe
Pictographs are a great introduction to working with data and graphs. Kids help the hamburger cafe compare the number of hamburgers they sold using pictographs.
Second Grade
Data and Graphing
Worksheet
Probability Toss 1
Worksheet
Probability Toss 1
Fifth Grade
Data and Graphing
What are the chances that a dart will land on an even number on a dart board? Find out in this sixth grade probability worksheet!
Worksheet
Probability Toss 1
Worksheet
Probability Toss 1
What are the chances that a dart will land on an even number on a dart board? Find out in this sixth grade probability worksheet!
Fifth Grade
Data and Graphing
Worksheet
Bounce that Ball: Learn Math While Doing Sports
Activity
Bounce that Ball: Learn Math While Doing Sports
First Grade
Data and Graphing
Head out to the driveway, ball in hand, for a bouncing challenge. Then use those results to make a colorful graph that lets your child compare results.
Activity
Bounce that Ball: Learn Math While Doing Sports
Activity
Bounce that Ball: Learn Math While Doing Sports
Head out to the driveway, ball in hand, for a bouncing challenge. Then use those results to make a colorful graph that lets your child compare results.
First Grade
Data and Graphing
Activity
Measurement and Graphing 1
Exercise
Measurement and Graphing 1
Third Grade
Fractions
This exercise will introduce students to the concept of taking measurements and graphing the data.
Exercise
Measurement and Graphing 1
Exercise
Measurement and Graphing 1
This exercise will introduce students to the concept of taking measurements and graphing the data.
Third Grade
Fractions
Exercise
Probability and Statistics 1
Exercise
Probability and Statistics 1
Third Grade
Data and Graphing
This engaging exercise will introduce students to probability and statistics in a way that excites them to continue learning.
Exercise
Probability and Statistics 1
Exercise
Probability and Statistics 1
This engaging exercise will introduce students to probability and statistics in a way that excites them to continue learning.
Third Grade
Data and Graphing
Exercise
Land Vehicles
Worksheet
Land Vehicles
Kindergarten
Data and Graphing
Need to get somewhere? Review the different modes of transportation with your little learner!
Worksheet
Land Vehicles
Worksheet
Land Vehicles
Need to get somewhere? Review the different modes of transportation with your little learner!
Kindergarten
Data and Graphing
Worksheet
Collecting and Organizing Data 1
Exercise
Collecting and Organizing Data 1
Third Grade
Data and Graphing
Students will learn how to collect and organize data thanks to this interesting exercise from Education.com.
Exercise
Collecting and Organizing Data 1
Exercise
Collecting and Organizing Data 1
Students will learn how to collect and organize data thanks to this interesting exercise from Education.com.
Third Grade
Data and Graphing
Exercise
Bar Graph: Getting to School
Worksheet
Bar Graph: Getting to School
Third Grade
Data and Graphing
Kids completing this third grade math worksheet use a bar graph to compare data about transportation to school and solve addition and subtraction problems.
Worksheet
Bar Graph: Getting to School
Worksheet
Bar Graph: Getting to School
Kids completing this third grade math worksheet use a bar graph to compare data about transportation to school and solve addition and subtraction problems.
Third Grade
Data and Graphing
Worksheet
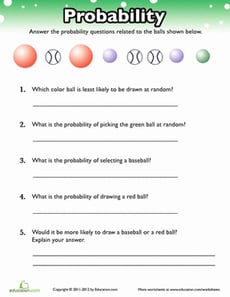
Probability Practice
Worksheet
Probability Practice
Fourth Grade
Data and Graphing
Get some practice with probability! With this exercise, your child will practice using fractions to express probability of different outcomes.
Worksheet
Probability Practice
Worksheet
Probability Practice
Get some practice with probability! With this exercise, your child will practice using fractions to express probability of different outcomes.
Fourth Grade
Data and Graphing
Worksheet
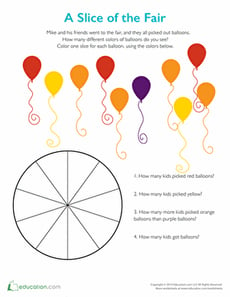
A Slice of the Fair: Pie Chart for Kids
Worksheet
A Slice of the Fair: Pie Chart for Kids
Second Grade
Data and Graphing
Who doesn't love a slice of pie and balloons? Color the different slices in this pie chart for kids to learn more about graphing.
Worksheet
A Slice of the Fair: Pie Chart for Kids
Worksheet
A Slice of the Fair: Pie Chart for Kids
Who doesn't love a slice of pie and balloons? Color the different slices in this pie chart for kids to learn more about graphing.
Second Grade
Data and Graphing
Worksheet
Do We Wear the Same Colors?
Activity
Do We Wear the Same Colors?
Third Grade
Data and Graphing
Hone observational skills and introduce the basics of data interpretation with this data gathering activity all about the different colors people wear.
Activity
Do We Wear the Same Colors?
Activity
Do We Wear the Same Colors?
Hone observational skills and introduce the basics of data interpretation with this data gathering activity all about the different colors people wear.
Third Grade
Data and Graphing
Activity
Less Than or Greater Than: 1 to 20
Game
Less Than or Greater Than: 1 to 20
First Grade
Numbers and Counting
The alligators are hungry for numbers, and kids use number skills to feed them.
Game
Less Than or Greater Than: 1 to 20
Game
Less Than or Greater Than: 1 to 20
The alligators are hungry for numbers, and kids use number skills to feed them.
First Grade
Numbers and Counting
Game
Probability Practice: Worms
Worksheet
Probability Practice: Worms
Fourth Grade
Data and Graphing
The early bird gets the worm! But which one will he choose? Have your child practice determining probability with a fun, visual exercise.
Worksheet
Probability Practice: Worms
Worksheet
Probability Practice: Worms
The early bird gets the worm! But which one will he choose? Have your child practice determining probability with a fun, visual exercise.
Fourth Grade
Data and Graphing
Worksheet
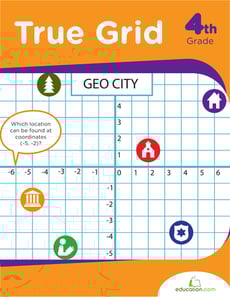
True Grid
Workbook
True Grid
Fourth Grade
Data and Graphing
Math can be a gritty business but, this workbook breaks down coordinate grids from different angles, from plotting simple points to finding hidden spies.
Workbook
True Grid
Workbook
True Grid
Math can be a gritty business but, this workbook breaks down coordinate grids from different angles, from plotting simple points to finding hidden spies.
Fourth Grade
Data and Graphing
Workbook
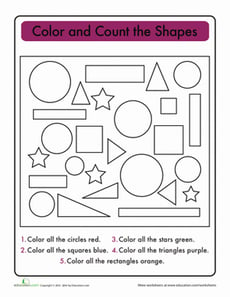
Super Shapes: Count and Graph
Worksheet
Super Shapes: Count and Graph
Kindergarten
Geometry
Introduce kids to key math skills on this shape-filled worksheet. Kids count and color the different shapes, then make a graph to show how many are pictured.
Worksheet
Super Shapes: Count and Graph
Worksheet
Super Shapes: Count and Graph
Introduce kids to key math skills on this shape-filled worksheet. Kids count and color the different shapes, then make a graph to show how many are pictured.
Kindergarten
Geometry
Worksheet
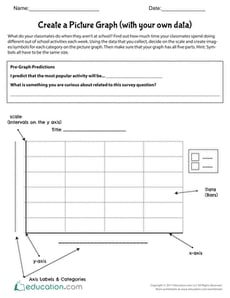
Create a Picture Graph (with your own data)
Worksheet
Create a Picture Graph (with your own data)
Fifth Grade
Data and Graphing
Using data that your students will generate in their class, they will create a picture graph that reflects how much time they spend doing different activities each week.
Worksheet
Create a Picture Graph (with your own data)
Worksheet
Create a Picture Graph (with your own data)
Using data that your students will generate in their class, they will create a picture graph that reflects how much time they spend doing different activities each week.
Fifth Grade
Data and Graphing
Worksheet
Practice Reading Venn Diagrams #1: Favorite Hobby
Worksheet
Practice Reading Venn Diagrams #1: Favorite Hobby
Second Grade
Data and Graphing
Kids practice reading a Venn diagram about favorite hobbies and answer questions about it in this 2nd grade math worksheet.
Worksheet
Practice Reading Venn Diagrams #1: Favorite Hobby
Worksheet
Practice Reading Venn Diagrams #1: Favorite Hobby
Kids practice reading a Venn diagram about favorite hobbies and answer questions about it in this 2nd grade math worksheet.
Second Grade
Data and Graphing
Worksheet
Pet Survey
Worksheet
Pet Survey
First Grade
Data and Graphing
Have your students survey one another about pet preferences using this interactive activity designed to practice representing and interpreting data.
Worksheet
Pet Survey
Worksheet
Pet Survey
Have your students survey one another about pet preferences using this interactive activity designed to practice representing and interpreting data.
First Grade
Data and Graphing
Worksheet
Probability Toss 2
Worksheet
Probability Toss 2
Fifth Grade
Data and Graphing
Boost your child's math know-how! What are the odds a dart would land on one of the given sections of this circle?
Worksheet
Probability Toss 2
Worksheet
Probability Toss 2
Boost your child's math know-how! What are the odds a dart would land on one of the given sections of this circle?
Fifth Grade
Data and Graphing
Worksheet
Ice Cream Bar Graph #5
Worksheet
Ice Cream Bar Graph #5
First Grade
Data and Graphing
Can you help Sam, Kate, and Becky keep track of ice cream sales? Get some practice with bar graphs, addition and subtraction all in one worksheet!
Worksheet
Ice Cream Bar Graph #5
Worksheet
Ice Cream Bar Graph #5
Can you help Sam, Kate, and Becky keep track of ice cream sales? Get some practice with bar graphs, addition and subtraction all in one worksheet!
First Grade
Data and Graphing
Worksheet
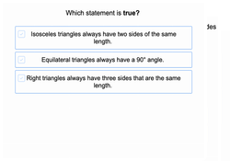
Geometry 7
Guided Lesson
Geometry 7
Fifth Grade
Geometry
This geometry unit engages students in analytical thinking as they learn about the properties of two dimensional figures and consider the different ways they can be sorted based on those properties. Students also learn to plot points, lines and shapes on a coordinate graph.
Guided Lesson
Geometry 7
Guided Lesson
Geometry 7
This geometry unit engages students in analytical thinking as they learn about the properties of two dimensional figures and consider the different ways they can be sorted based on those properties. Students also learn to plot points, lines and shapes on a coordinate graph.
Fifth Grade
Geometry
Guided Lesson
Create a Line Plot with Data Provided
Worksheet
Create a Line Plot with Data Provided
Third Grade
Data and Graphing
Use the data provided to have your students create a line plot that reflects how much TV watched per week for one third grade class.
Worksheet
Create a Line Plot with Data Provided
Worksheet
Create a Line Plot with Data Provided
Use the data provided to have your students create a line plot that reflects how much TV watched per week for one third grade class.
Third Grade
Data and Graphing
Worksheet
1
2
3
4