SKIP TO CONTENT
Worksheet Generator
Subjects
Grades
Worksheets
Games
Build a Worksheet
More Resources
Roly Recommends
Subjects
Grades
Worksheets
Games
Build a Worksheet
More Resources
Roly Recommends
All Subjects
Math
Data and Graphing
Subtopics:
Collecting and Organizing Data
Picture Graphs
Bar Graphs
Line Plots
Coordinate Plane
Show Less
Filters
Search for: number, sense, 2
✕
Math
✕
1st - 4th Grade
✕
Subjects
Math
English Language Arts
Science
Social Studies
Foreign Language
Grade Level
Pre-K
K
1st
2nd
3rd
4th
5th
6th
7th
8th
Early Childhood
Elementary School
Middle School
Resource Type
Worksheets
Games
Lesson Plans
Interactive Worksheets
Workbooks
Activities
Exercises
Offline Games
Guided Lessons
Occasion
Birthdays
St. Patrick's Day
Summer
Halloween
Holidays
Valentine's Day
Common Core
Yes
Game Type
Ball Games
Arts & Crafts
Arts & Crafts
Paper & Glue Crafts
English Language Support
Yes
See More
Clear All
View 76 results
Showing Results for number sense 2
76 results
Search for: number, sense, 2
✕
Math
✕
1st - 4th Grade
✕
Clear All
Sort by:
Relevance
Most recent
Most popular
Alphabetical A-Z
Alphabetical Z-A
All filters
76 results
Sort by:
Relevance
Most recent
Most popular
Alphabetical A-Z
Alphabetical Z-A
Comparing Pictographs: Football Time
Worksheet
Comparing Pictographs: Football Time
Third Grade
Data and Graphing
In this math worksheet, kids compare two pictographs that record the number of footballs kicked and the number of footballs thrown on the field.
Worksheet
Comparing Pictographs: Football Time
Worksheet
Comparing Pictographs: Football Time
In this math worksheet, kids compare two pictographs that record the number of footballs kicked and the number of footballs thrown on the field.
Third Grade
Data and Graphing
Worksheet
Using Base 10 Drawings in Two-Digit Addition
Worksheet
Using Base 10 Drawings in Two-Digit Addition
Second Grade
Addition
This worksheet teaches you to use base 10 drawings to add two-digit numbers.
Worksheet
Using Base 10 Drawings in Two-Digit Addition
Worksheet
Using Base 10 Drawings in Two-Digit Addition
This worksheet teaches you to use base 10 drawings to add two-digit numbers.
Second Grade
Addition
Worksheet
Reading a Bar Graph: Number of Athletes
Worksheet
Reading a Bar Graph: Number of Athletes
Third Grade
Data and Graphing
In this sports-themed worksheet, children use a bar graph to answer six questions about the number of athletes playing at a time in a variety of sporting events.
Worksheet
Reading a Bar Graph: Number of Athletes
Worksheet
Reading a Bar Graph: Number of Athletes
In this sports-themed worksheet, children use a bar graph to answer six questions about the number of athletes playing at a time in a variety of sporting events.
Third Grade
Data and Graphing
Worksheet
Measurement and Data 2
Guided Lesson
Measurement and Data 2
First Grade
Measurement
Measurement and data in first grade includes such important concepts as comparing the length and weight of two objects using a third object. This guided lesson, designed by curriculum experts, takes students on an exploration of these measurement and data concepts. Once through with the lesson, kids can gain extra practice with measurement and data with the accompanying worksheets.
Guided Lesson
Measurement and Data 2
Guided Lesson
Measurement and Data 2
Measurement and data in first grade includes such important concepts as comparing the length and weight of two objects using a third object. This guided lesson, designed by curriculum experts, takes students on an exploration of these measurement and data concepts. Once through with the lesson, kids can gain extra practice with measurement and data with the accompanying worksheets.
First Grade
Measurement
Guided Lesson
Comparing Pictographs: Tulips and Daisies
Worksheet
Comparing Pictographs: Tulips and Daisies
Second Grade
Data and Graphing
Your child will use the data in two pictographs that show the number of tulips and daisies imported from certain European countries to answer word problems.
Worksheet
Comparing Pictographs: Tulips and Daisies
Worksheet
Comparing Pictographs: Tulips and Daisies
Your child will use the data in two pictographs that show the number of tulips and daisies imported from certain European countries to answer word problems.
Second Grade
Data and Graphing
Worksheet
Less Than or Greater Than: 1 to 20
Game
Less Than or Greater Than: 1 to 20
First Grade
Numbers and Counting
The alligators are hungry for numbers, and kids use number skills to feed them.
Game
Less Than or Greater Than: 1 to 20
Game
Less Than or Greater Than: 1 to 20
The alligators are hungry for numbers, and kids use number skills to feed them.
First Grade
Numbers and Counting
Game
Probability and Statistics 2
Exercise
Probability and Statistics 2
Fourth Grade
Data and Graphing
Continue the probability and statistics fun with this involving exercise that shows students how to use data to make predictions.
Exercise
Probability and Statistics 2
Exercise
Probability and Statistics 2
Continue the probability and statistics fun with this involving exercise that shows students how to use data to make predictions.
Fourth Grade
Data and Graphing
Exercise
Collecting and Organizing Data 2
Exercise
Collecting and Organizing Data 2
Fourth Grade
Data and Graphing
Your students will grow adept at collecting and organizing data around them with this engaging exercise.
Exercise
Collecting and Organizing Data 2
Exercise
Collecting and Organizing Data 2
Your students will grow adept at collecting and organizing data around them with this engaging exercise.
Fourth Grade
Data and Graphing
Exercise
Ice Cream Bar Graph #2
Worksheet
Ice Cream Bar Graph #2
First Grade
Data and Graphing
Help keep track of ice cream sales with some bar graph practice! Your child will have a scoop full of fun figuring out which friend sold the most ice cream.
Worksheet
Ice Cream Bar Graph #2
Worksheet
Ice Cream Bar Graph #2
Help keep track of ice cream sales with some bar graph practice! Your child will have a scoop full of fun figuring out which friend sold the most ice cream.
First Grade
Data and Graphing
Worksheet
Pictograph Practice: Hamburger Cafe
Worksheet
Pictograph Practice: Hamburger Cafe
Second Grade
Data and Graphing
Pictographs are a great introduction to working with data and graphs. Kids help the hamburger cafe compare the number of hamburgers they sold using pictographs.
Worksheet
Pictograph Practice: Hamburger Cafe
Worksheet
Pictograph Practice: Hamburger Cafe
Pictographs are a great introduction to working with data and graphs. Kids help the hamburger cafe compare the number of hamburgers they sold using pictographs.
Second Grade
Data and Graphing
Worksheet
Sort 2D and 3D Shapes
Interactive Worksheet
Sort 2D and 3D Shapes
Kindergarten
Geometry
Can your kid tell the difference between 2-dimensional and 3-dimensional shapes? Kindergarten is a good time to start!
Interactive Worksheet
Sort 2D and 3D Shapes
Interactive Worksheet
Sort 2D and 3D Shapes
Can your kid tell the difference between 2-dimensional and 3-dimensional shapes? Kindergarten is a good time to start!
Kindergarten
Geometry
Interactive Worksheet
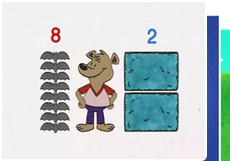
Basic Pictographs
Worksheet
Basic Pictographs
First Grade
Data and Graphing
Practice adding multiple digits with a fun pictograph page. Use the chart to draw out the number of items in each problem.
Worksheet
Basic Pictographs
Worksheet
Basic Pictographs
Practice adding multiple digits with a fun pictograph page. Use the chart to draw out the number of items in each problem.
First Grade
Data and Graphing
Worksheet
Comparing Pictographs: Taxi, Taxi
Worksheet
Comparing Pictographs: Taxi, Taxi
Third Grade
Addition
In this 3rd grade math worksheet, kids analyze and compare data in two pictographs in order to answer a set of word problems.
Worksheet
Comparing Pictographs: Taxi, Taxi
Worksheet
Comparing Pictographs: Taxi, Taxi
In this 3rd grade math worksheet, kids analyze and compare data in two pictographs in order to answer a set of word problems.
Third Grade
Addition
Worksheet
Lemonade Stand Pictograph
Worksheet
Lemonade Stand Pictograph
Second Grade
Data and Graphing
See how Susie's lemonade stand is doing! Students will learn how to analyze and compare data by answering questions based on the two pictographs.
Worksheet
Lemonade Stand Pictograph
Worksheet
Lemonade Stand Pictograph
See how Susie's lemonade stand is doing! Students will learn how to analyze and compare data by answering questions based on the two pictographs.
Second Grade
Data and Graphing
Worksheet
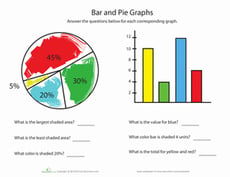
Different Types of Graphs: Picture and Bar Graphs
Worksheet
Different Types of Graphs: Picture and Bar Graphs
First Grade
Data and Graphing
Sure to test your kid's graphing skills, this graph worksheet features two different types of graphs and questions to go along with them.
Worksheet
Different Types of Graphs: Picture and Bar Graphs
Worksheet
Different Types of Graphs: Picture and Bar Graphs
Sure to test your kid's graphing skills, this graph worksheet features two different types of graphs and questions to go along with them.
First Grade
Data and Graphing
Worksheet
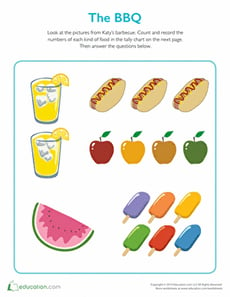
The BBQ Tally
Worksheet
The BBQ Tally
Second Grade
Data and Graphing
Your student will use the colorful pictures to count the number of food items that were consumed and record the information using the tally chart provided.
Worksheet
The BBQ Tally
Worksheet
The BBQ Tally
Your student will use the colorful pictures to count the number of food items that were consumed and record the information using the tally chart provided.
Second Grade
Data and Graphing
Worksheet
Tally Ho!
Worksheet
Tally Ho!
First Grade
Data and Graphing
Does you kid have a favorite food? This worksheet challenges him to count the number of votes on a chart, then answer some questions about the results.
Worksheet
Tally Ho!
Worksheet
Tally Ho!
Does you kid have a favorite food? This worksheet challenges him to count the number of votes on a chart, then answer some questions about the results.
First Grade
Data and Graphing
Worksheet
Pictograph Graph: Mr. Postman
Worksheet
Pictograph Graph: Mr. Postman
Second Grade
Data and Graphing
Boost your child's data know-how with a lesson on reading and understanding a math pictograph, a kind of graph in which pictures stand in for number data.
Worksheet
Pictograph Graph: Mr. Postman
Worksheet
Pictograph Graph: Mr. Postman
Boost your child's data know-how with a lesson on reading and understanding a math pictograph, a kind of graph in which pictures stand in for number data.
Second Grade
Data and Graphing
Worksheet
Practice Reading Venn Diagrams #2: In the Orchestra
Worksheet
Practice Reading Venn Diagrams #2: In the Orchestra
Second Grade
Data and Graphing
Kids practice reading a Venn diagram about instruments in an orchestra and answering questions about it in this 2nd grade math worksheet.
Worksheet
Practice Reading Venn Diagrams #2: In the Orchestra
Worksheet
Practice Reading Venn Diagrams #2: In the Orchestra
Kids practice reading a Venn diagram about instruments in an orchestra and answering questions about it in this 2nd grade math worksheet.
Second Grade
Data and Graphing
Worksheet
Graph My Design
Lesson Plan
Graph My Design
First Grade
Geometry
Geometry meets data in this fun lesson! Students will build a design using pattern blocks and then graph the number of each shape used. This scaffolded EL lesson can be used alone or alongside
Graphing Colored Counters.
Lesson Plan
Graph My Design
Lesson Plan
Graph My Design
Geometry meets data in this fun lesson! Students will build a design using pattern blocks and then graph the number of each shape used. This scaffolded EL lesson can be used alone or alongside
Graphing Colored Counters.
First Grade
Geometry
Lesson Plan
Measurement and Data 4
Guided Lesson
Measurement and Data 4
Fourth Grade
Fractions
Representing data on graphs makes math visual and involves some creativity and design. Plotting data using fractional units takes their learning one step further. Also in this unit, students learn to measure using both traditional units (like inches, feet and yards) and metric units, and how to convert measurements within each system. The concept of measurement gets two dimensional when students explore measuring and working with angles.
Guided Lesson
Measurement and Data 4
Guided Lesson
Measurement and Data 4
Representing data on graphs makes math visual and involves some creativity and design. Plotting data using fractional units takes their learning one step further. Also in this unit, students learn to measure using both traditional units (like inches, feet and yards) and metric units, and how to convert measurements within each system. The concept of measurement gets two dimensional when students explore measuring and working with angles.
Fourth Grade
Fractions
Guided Lesson
Data and Graphing
Workbook
Data and Graphing
Third Grade
Data and Graphing
Become a master of analysis! In this series, kids practice collecting, creating and plotting data on graphs. Then they'll practice reading graphs, making predictions, and comparing data.
Workbook
Data and Graphing
Workbook
Data and Graphing
Become a master of analysis! In this series, kids practice collecting, creating and plotting data on graphs. Then they'll practice reading graphs, making predictions, and comparing data.
Third Grade
Data and Graphing
Workbook
Dice Probability
Activity
Dice Probability
Fourth Grade
Data and Graphing
Analyze this simple betting game with your fourth grade student in order to discuss probability.
Activity
Dice Probability
Activity
Dice Probability
Analyze this simple betting game with your fourth grade student in order to discuss probability.
Fourth Grade
Data and Graphing
Activity
Mean, Median and Mode Madness!
Lesson Plan
Mean, Median and Mode Madness!
Third Grade
Data and Graphing
This lesson introduces students to the concepts of mean, median, and mode in a hands-on and visual way.
Lesson Plan
Mean, Median and Mode Madness!
Lesson Plan
Mean, Median and Mode Madness!
This lesson introduces students to the concepts of mean, median, and mode in a hands-on and visual way.
Third Grade
Data and Graphing
Lesson Plan
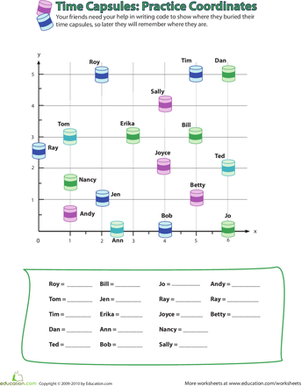
Coordinates Activity
Worksheet
Coordinates Activity
Fourth Grade
Data and Graphing
Ask your child to help some imaginary friends determine where they buried their time capsules by determining the coordinates of each spot.
Worksheet
Coordinates Activity
Worksheet
Coordinates Activity
Ask your child to help some imaginary friends determine where they buried their time capsules by determining the coordinates of each spot.
Fourth Grade
Data and Graphing
Worksheet
Subtraction Action
Activity
Subtraction Action
Third Grade
Data and Graphing
Most parents probably wouldn't mind subtracting 8-9 years off their age. Here's a fun third grade subtraction activity that may do just that.
Activity
Subtraction Action
Activity
Subtraction Action
Most parents probably wouldn't mind subtracting 8-9 years off their age. Here's a fun third grade subtraction activity that may do just that.
Third Grade
Data and Graphing
Activity
Scaled Bar Graphs in Space
Game
Scaled Bar Graphs in Space
Third Grade
Data and Graphing
Out of this world! Kids help Roly collect, sort, and graph random objects in this silly space game.
Game
Scaled Bar Graphs in Space
Game
Scaled Bar Graphs in Space
Out of this world! Kids help Roly collect, sort, and graph random objects in this silly space game.
Third Grade
Data and Graphing
Game
Christmas Graphing
Worksheet
Christmas Graphing
Second Grade
Data and Graphing
Use a pictograph to find out how many presents Minnie wrapped this year.
Worksheet
Christmas Graphing
Worksheet
Christmas Graphing
Use a pictograph to find out how many presents Minnie wrapped this year.
Second Grade
Data and Graphing
Worksheet
Bounce that Ball: Learn Math While Doing Sports
Activity
Bounce that Ball: Learn Math While Doing Sports
First Grade
Data and Graphing
Head out to the driveway, ball in hand, for a bouncing challenge. Then use those results to make a colorful graph that lets your child compare results.
Activity
Bounce that Ball: Learn Math While Doing Sports
Activity
Bounce that Ball: Learn Math While Doing Sports
Head out to the driveway, ball in hand, for a bouncing challenge. Then use those results to make a colorful graph that lets your child compare results.
First Grade
Data and Graphing
Activity
Draw a Birthday Bar Graph
Activity
Draw a Birthday Bar Graph
Third Grade
Data and Graphing
Liven up a lesson about graphing by helping your third grader compile a bar graph from his classmates' birthday data.
Activity
Draw a Birthday Bar Graph
Activity
Draw a Birthday Bar Graph
Liven up a lesson about graphing by helping your third grader compile a bar graph from his classmates' birthday data.
Third Grade
Data and Graphing
Activity
1
2
3