SKIP TO CONTENT
Worksheet Generator
Subjects
Grades
Worksheets
Games
Build a Worksheet
More Resources
Roly Recommends
Subjects
Grades
Worksheets
Games
Build a Worksheet
More Resources
Roly Recommends
All Subjects
Math
Data and Graphing
Subtopics:
Collecting and Organizing Data
Picture Graphs
Bar Graphs
Line Plots
Coordinate Plane
Show Less
Filters
Search for: read, learn, natural
✕
Math
✕
1st - 4th Grade
✕
Subjects
Math
English Language Arts
Science
Social Studies
Foreign Language
Grade Level
Pre-K
K
1st
2nd
3rd
4th
5th
6th
7th
8th
Early Childhood
Elementary School
Middle School
Resource Type
Worksheets
Games
Lesson Plans
Interactive Worksheets
Activities
Exercises
Offline Games
Guided Lessons
Occasion
Summer
Holidays
Hanukkah
Valentine's Day
Common Core
Yes
Game Type
Ball Games
English Language Support
Yes
See More
Clear All
View 72 results
Showing Results for read learn natural : Page 3
72 results
Search for: read, learn, natural
✕
Math
✕
1st - 4th Grade
✕
Clear All
Sort by:
Relevance
Most recent
Most popular
Alphabetical A-Z
Alphabetical Z-A
All filters
72 results
Sort by:
Relevance
Most recent
Most popular
Alphabetical A-Z
Alphabetical Z-A
Coordinate Grid Map
Worksheet
Coordinate Grid Map
Fourth Grade
Geometry
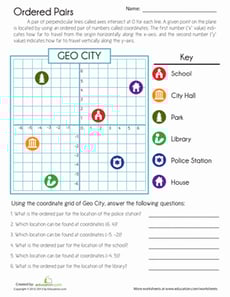
Navigate this map of Geo City! Put those graphing skills to the test by identifying and locating ordered pairs on this coordinate grid map.
Worksheet
Coordinate Grid Map
Worksheet
Coordinate Grid Map
Navigate this map of Geo City! Put those graphing skills to the test by identifying and locating ordered pairs on this coordinate grid map.
Fourth Grade
Geometry
Worksheet
Reading a Bar Graph: Number of Athletes
Worksheet
Reading a Bar Graph: Number of Athletes
Third Grade
Data and Graphing
In this sports-themed worksheet, children use a bar graph to answer six questions about the number of athletes playing at a time in a variety of sporting events.
Worksheet
Reading a Bar Graph: Number of Athletes
Worksheet
Reading a Bar Graph: Number of Athletes
In this sports-themed worksheet, children use a bar graph to answer six questions about the number of athletes playing at a time in a variety of sporting events.
Third Grade
Data and Graphing
Worksheet
Creating a Bar Graph: Favorite Picnic Spots
Worksheet
Creating a Bar Graph: Favorite Picnic Spots
Second Grade
Data and Graphing
Learners practice charting and graphing data in this hands-on worksheet.
Worksheet
Creating a Bar Graph: Favorite Picnic Spots
Worksheet
Creating a Bar Graph: Favorite Picnic Spots
Learners practice charting and graphing data in this hands-on worksheet.
Second Grade
Data and Graphing
Worksheet
Weather Graph
Worksheet
Weather Graph
First Grade
Data and Graphing
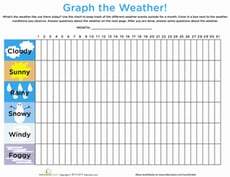
Observe and record the weather with your kindergartener with this cute fill-in weather graph.
Worksheet
Weather Graph
Worksheet
Weather Graph
Observe and record the weather with your kindergartener with this cute fill-in weather graph.
First Grade
Data and Graphing
Worksheet
Bar Graphs: Interpreting Data
Lesson Plan
Bar Graphs: Interpreting Data
Second Grade
Data and Graphing
In this lesson, students will make bar graphs and interpret data using real-life data from other students. They will get practice writing and answering survey questions.
Lesson Plan
Bar Graphs: Interpreting Data
Lesson Plan
Bar Graphs: Interpreting Data
In this lesson, students will make bar graphs and interpret data using real-life data from other students. They will get practice writing and answering survey questions.
Second Grade
Data and Graphing
Lesson Plan
Math + Love = Valentine's Day Bar Graph
Lesson Plan
Math + Love = Valentine's Day Bar Graph
Second Grade
Data and Graphing
What's more romantic than a bar graph on Valentine's Day? In this Valentine's Day lesson plan, students will use information from a data set to create their own tally charts and bar graphs and then analyze these graphs to answer questions.
Lesson Plan
Math + Love = Valentine's Day Bar Graph
Lesson Plan
Math + Love = Valentine's Day Bar Graph
What's more romantic than a bar graph on Valentine's Day? In this Valentine's Day lesson plan, students will use information from a data set to create their own tally charts and bar graphs and then analyze these graphs to answer questions.
Second Grade
Data and Graphing
Lesson Plan
Graph Money
Activity
Graph Money
Second Grade
Data and Graphing
Give your smart second grader a rich challenge with this activity that combines graphing practice with money!
Activity
Graph Money
Activity
Graph Money
Give your smart second grader a rich challenge with this activity that combines graphing practice with money!
Second Grade
Data and Graphing
Activity
Mighty Mean, Median, and Mode
Lesson Plan
Mighty Mean, Median, and Mode
Fourth Grade
Data and Graphing
Give your students a good basis in interpreting data with this lesson that teaches them about mean, median, and mode with plenty of practice and cute videos to keep them interested.
Lesson Plan
Mighty Mean, Median, and Mode
Lesson Plan
Mighty Mean, Median, and Mode
Give your students a good basis in interpreting data with this lesson that teaches them about mean, median, and mode with plenty of practice and cute videos to keep them interested.
Fourth Grade
Data and Graphing
Lesson Plan
Game of Chance
Activity
Game of Chance
Third Grade
Data and Graphing
This fun math card game is a great opportunity to discuss probability with your third grader.
Activity
Game of Chance
Activity
Game of Chance
This fun math card game is a great opportunity to discuss probability with your third grader.
Third Grade
Data and Graphing
Activity
Make a Menorah Light Chart
Activity
Make a Menorah Light Chart
Second Grade
Data and Graphing
Your child can brush up on her math skills by charting the length of time that each candle on the menorah takes to burn.
Activity
Make a Menorah Light Chart
Activity
Make a Menorah Light Chart
Your child can brush up on her math skills by charting the length of time that each candle on the menorah takes to burn.
Second Grade
Data and Graphing
Activity
Graph My Design
Lesson Plan
Graph My Design
First Grade
Geometry
Geometry meets data in this fun lesson! Students will build a design using pattern blocks and then graph the number of each shape used. This scaffolded EL lesson can be used alone or alongside
Graphing Colored Counters.
Lesson Plan
Graph My Design
Lesson Plan
Graph My Design
Geometry meets data in this fun lesson! Students will build a design using pattern blocks and then graph the number of each shape used. This scaffolded EL lesson can be used alone or alongside
Graphing Colored Counters.
First Grade
Geometry
Lesson Plan
Dice Probability
Activity
Dice Probability
Fourth Grade
Data and Graphing
Analyze this simple betting game with your fourth grade student in order to discuss probability.
Activity
Dice Probability
Activity
Dice Probability
Analyze this simple betting game with your fourth grade student in order to discuss probability.
Fourth Grade
Data and Graphing
Activity
1
2
3