SKIP TO CONTENT
Worksheet Generator
Subjects
Grades
Worksheets
Games
Build a Worksheet
More Resources
Roly Recommends
Subjects
Grades
Worksheets
Games
Build a Worksheet
More Resources
Roly Recommends
All Subjects
Math
Data and Graphing
Subtopics:
Collecting and Organizing Data
Picture Graphs
Bar Graphs
Line Plots
Coordinate Plane
Show Less
Filters
Search for: how, when, and, where, 1
✕
Math
✕
1st - 4th Grade
✕
Subjects
Math
English Language Arts
Science
Social Studies
Foreign Language
Grade Level
Pre-K
K
1st
2nd
3rd
4th
5th
6th
7th
8th
Early Childhood
Elementary School
Middle School
Resource Type
Worksheets
Games
Lesson Plans
Interactive Worksheets
Activities
Exercises
Offline Games
Guided Lessons
Occasion
Birthdays
St. Patrick's Day
Summer
Back to School
Halloween
Holidays
Hanukkah
Valentine's Day
Common Core
Yes
Game Type
Ball Games
Arts & Crafts
Arts & Crafts
Paper & Glue Crafts
English Language Support
Yes
See More
Clear All
View 131 results
Showing Results for how when and where 1 : Page 2
131 results
Search for: how, when, and, where, 1
✕
Math
✕
1st - 4th Grade
✕
Clear All
Sort by:
Relevance
Most recent
Most popular
Alphabetical A-Z
Alphabetical Z-A
All filters
131 results
Sort by:
Relevance
Most recent
Most popular
Alphabetical A-Z
Alphabetical Z-A
Hiking Buddies Pictograph
Worksheet
Hiking Buddies Pictograph
Second Grade
Data and Graphing
This pictograph shows how many hikes Eric and his friends went on this month. Use the information to answer questions and determine who hiked the most.
Worksheet
Hiking Buddies Pictograph
Worksheet
Hiking Buddies Pictograph
This pictograph shows how many hikes Eric and his friends went on this month. Use the information to answer questions and determine who hiked the most.
Second Grade
Data and Graphing
Worksheet
Reading Pictographs: Carrots for Bunnies
Worksheet
Reading Pictographs: Carrots for Bunnies
Third Grade
Data and Graphing
How many carrots did Sammy's pet bunny eat? Kids use information in the pictograph to answer word problems in this bunny-filled math worksheet.
Worksheet
Reading Pictographs: Carrots for Bunnies
Worksheet
Reading Pictographs: Carrots for Bunnies
How many carrots did Sammy's pet bunny eat? Kids use information in the pictograph to answer word problems in this bunny-filled math worksheet.
Third Grade
Data and Graphing
Worksheet
Jake's Nature Hike
Worksheet
Jake's Nature Hike
Second Grade
Data and Graphing
How many animals have you seen on your hikes? Jake saw many animals on his! Create your own bar graph with the information given.
Worksheet
Jake's Nature Hike
Worksheet
Jake's Nature Hike
How many animals have you seen on your hikes? Jake saw many animals on his! Create your own bar graph with the information given.
Second Grade
Data and Graphing
Worksheet
In the Band Pie Graph
Worksheet
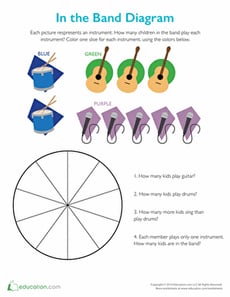
In the Band Pie Graph
Second Grade
Data and Graphing
Rock out with this pie chart! Enjoy learning how to make a pie graph and interpret data while answering questions based on the information given.
Worksheet
In the Band Pie Graph
Worksheet
In the Band Pie Graph
Rock out with this pie chart! Enjoy learning how to make a pie graph and interpret data while answering questions based on the information given.
Second Grade
Data and Graphing
Worksheet
Ice Cream Graph #15
Worksheet
Ice Cream Graph #15
First Grade
Data and Graphing
Three kids set up an ice cream stand, but they need your child's help figuring out how much they sold. Help Sam, Kate, and Becky calculate their sales and more.
Worksheet
Ice Cream Graph #15
Worksheet
Ice Cream Graph #15
Three kids set up an ice cream stand, but they need your child's help figuring out how much they sold. Help Sam, Kate, and Becky calculate their sales and more.
First Grade
Data and Graphing
Worksheet
Reading Pictographs: Tomato Fest!
Worksheet
Reading Pictographs: Tomato Fest!
Third Grade
Data and Graphing
The farmers are busy picking tomatoes! Kids practice reading a pictograph to help Mr. Farmer figure out how many tomatoes he picked in this worksheet.
Worksheet
Reading Pictographs: Tomato Fest!
Worksheet
Reading Pictographs: Tomato Fest!
The farmers are busy picking tomatoes! Kids practice reading a pictograph to help Mr. Farmer figure out how many tomatoes he picked in this worksheet.
Third Grade
Data and Graphing
Worksheet
Ice Cream Graph #14
Worksheet
Ice Cream Graph #14
First Grade
Data and Graphing
Ice cream for sale! Help Sam, Kate and Becky keep track of how many ice cream cones they've sold, and draw this data into a pictograph.
Worksheet
Ice Cream Graph #14
Worksheet
Ice Cream Graph #14
Ice cream for sale! Help Sam, Kate and Becky keep track of how many ice cream cones they've sold, and draw this data into a pictograph.
First Grade
Data and Graphing
Worksheet
Pictograph Graph: Mr. Postman
Worksheet
Pictograph Graph: Mr. Postman
Second Grade
Data and Graphing
Boost your child's data know-how with a lesson on reading and understanding a math pictograph, a kind of graph in which pictures stand in for number data.
Worksheet
Pictograph Graph: Mr. Postman
Worksheet
Pictograph Graph: Mr. Postman
Boost your child's data know-how with a lesson on reading and understanding a math pictograph, a kind of graph in which pictures stand in for number data.
Second Grade
Data and Graphing
Worksheet
Tally Time: On the Farm
Worksheet
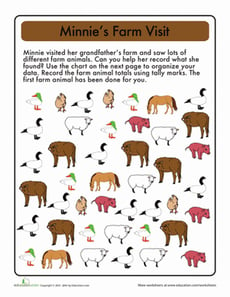
Tally Time: On the Farm
First Grade
Data and Graphing
Kids help Minnie figure out how many pigs, sheep, and other animals live on the farm by reading the tables and counting up the tally marks.
Worksheet
Tally Time: On the Farm
Worksheet
Tally Time: On the Farm
Kids help Minnie figure out how many pigs, sheep, and other animals live on the farm by reading the tables and counting up the tally marks.
First Grade
Data and Graphing
Worksheet
Graphing Survey Data
Worksheet
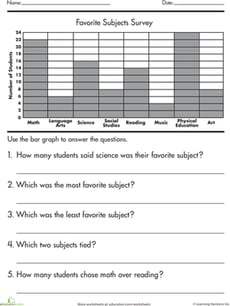
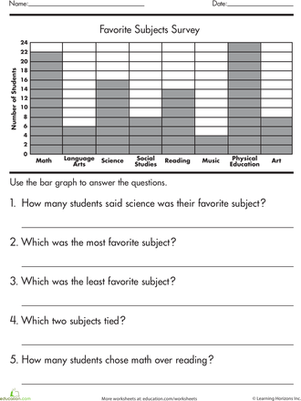
Graphing Survey Data
Second Grade
Data and Graphing
If your second grader is stumped by bar graphs, clear up the confusion with this worksheet that helps kids learn how to read and interpret a bar graph.
Worksheet
Graphing Survey Data
Worksheet
Graphing Survey Data
If your second grader is stumped by bar graphs, clear up the confusion with this worksheet that helps kids learn how to read and interpret a bar graph.
Second Grade
Data and Graphing
Worksheet
Probability Practice: Flowers
Worksheet
Probability Practice: Flowers
Fourth Grade
Data and Graphing
Can you guess which flower the bee will choose? With this exercise your child will learn how to determine the likelihood of the bee choosing a certain flower.
Worksheet
Probability Practice: Flowers
Worksheet
Probability Practice: Flowers
Can you guess which flower the bee will choose? With this exercise your child will learn how to determine the likelihood of the bee choosing a certain flower.
Fourth Grade
Data and Graphing
Worksheet
Super Shapes: Count and Graph
Worksheet
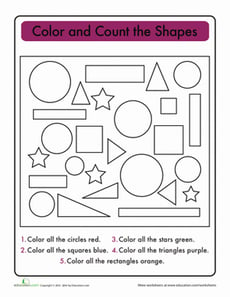
Super Shapes: Count and Graph
Kindergarten
Geometry
Introduce kids to key math skills on this shape-filled worksheet. Kids count and color the different shapes, then make a graph to show how many are pictured.
Worksheet
Super Shapes: Count and Graph
Worksheet
Super Shapes: Count and Graph
Introduce kids to key math skills on this shape-filled worksheet. Kids count and color the different shapes, then make a graph to show how many are pictured.
Kindergarten
Geometry
Worksheet
Graphing Favorite Pets
Worksheet
Graphing Favorite Pets
First Grade
Data and Graphing
Mix up math lessons with this pet-inspired graphing exercise. This is an interactive way to teach your students how to collect data and graph their findings.
Worksheet
Graphing Favorite Pets
Worksheet
Graphing Favorite Pets
Mix up math lessons with this pet-inspired graphing exercise. This is an interactive way to teach your students how to collect data and graph their findings.
First Grade
Data and Graphing
Worksheet
Pictographs: Say Cheese!
Worksheet
Pictographs: Say Cheese!
Third Grade
Data and Graphing
To keep track of his cheese sales, Giovanni uses a pictograph. Kids will figure out how his cheese business is doing by using data in the graph.
Worksheet
Pictographs: Say Cheese!
Worksheet
Pictographs: Say Cheese!
To keep track of his cheese sales, Giovanni uses a pictograph. Kids will figure out how his cheese business is doing by using data in the graph.
Third Grade
Data and Graphing
Worksheet
Ice Cream Bar Graph #9
Worksheet
Ice Cream Bar Graph #9
First Grade
Data and Graphing
Sam, Kate, and Becky have just had a long day of selling ice cream cones, and they want to know how many were sold. Help them with this pictograph worksheet.
Worksheet
Ice Cream Bar Graph #9
Worksheet
Ice Cream Bar Graph #9
Sam, Kate, and Becky have just had a long day of selling ice cream cones, and they want to know how many were sold. Help them with this pictograph worksheet.
First Grade
Data and Graphing
Worksheet
Ice Cream Graph #19
Worksheet
Ice Cream Graph #19
First Grade
Data and Graphing
Ice cream for sale! Sam, Kate, and Becky need help keeping track of how many ice cream cones they've sold. Your child will complete a pictograph to help them.
Worksheet
Ice Cream Graph #19
Worksheet
Ice Cream Graph #19
Ice cream for sale! Sam, Kate, and Becky need help keeping track of how many ice cream cones they've sold. Your child will complete a pictograph to help them.
First Grade
Data and Graphing
Worksheet
Tally Chart: At the Sushi Counter
Worksheet
Tally Chart: At the Sushi Counter
First Grade
Data and Graphing
The chef made a lot of sushi today during lunch. Can your child help him figure out how much sushi he made by filling in the table with tally marks?
Worksheet
Tally Chart: At the Sushi Counter
Worksheet
Tally Chart: At the Sushi Counter
The chef made a lot of sushi today during lunch. Can your child help him figure out how much sushi he made by filling in the table with tally marks?
First Grade
Data and Graphing
Worksheet
Graph My Design
Worksheet
Graph My Design
First Grade
Data and Graphing
Students build a design and then use this bar graph to show how many of each shape was used. Place inside a sheet protector to reuse.
Worksheet
Graph My Design
Worksheet
Graph My Design
Students build a design and then use this bar graph to show how many of each shape was used. Place inside a sheet protector to reuse.
First Grade
Data and Graphing
Worksheet
Graph Practice
Interactive Worksheet
Graph Practice
Second Grade
Data and Graphing
Don't let your second grader forget graphs! Be sure to review how to read a bar graph and pictograph with help from this handy worksheet. Challenge your young mathematician to read the graphs and answer some questions.
Interactive Worksheet
Graph Practice
Interactive Worksheet
Graph Practice
Don't let your second grader forget graphs! Be sure to review how to read a bar graph and pictograph with help from this handy worksheet. Challenge your young mathematician to read the graphs and answer some questions.
Second Grade
Data and Graphing
Interactive Worksheet
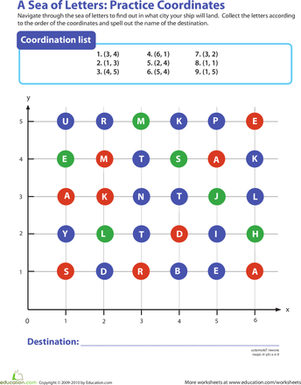
Coordinate Grid: A Sea of Letters
Worksheet
Coordinate Grid: A Sea of Letters
Fourth Grade
Geometry
Challenge your fourth grader to navigate through the sea of letters according to each coordinate to spell out a destination city's name.
Worksheet
Coordinate Grid: A Sea of Letters
Worksheet
Coordinate Grid: A Sea of Letters
Challenge your fourth grader to navigate through the sea of letters according to each coordinate to spell out a destination city's name.
Fourth Grade
Geometry
Worksheet
Study of Names
Activity
Study of Names
Third Grade
Data and Graphing
Graph are a great way to organize information. Your child will get to practice graphing by creating a bar graph and a pictorial graph of her friend's names.
Activity
Study of Names
Activity
Study of Names
Graph are a great way to organize information. Your child will get to practice graphing by creating a bar graph and a pictorial graph of her friend's names.
Third Grade
Data and Graphing
Activity
What Doesn't Belong? A Categorization Game
Activity
What Doesn't Belong? A Categorization Game
Third Grade
Data and Graphing
This educated-guessing game is great for preschoolers. This activity helps your child work on her reasoning skills.
Activity
What Doesn't Belong? A Categorization Game
Activity
What Doesn't Belong? A Categorization Game
This educated-guessing game is great for preschoolers. This activity helps your child work on her reasoning skills.
Third Grade
Data and Graphing
Activity
Math + Love = Valentine's Day Bar Graph
Lesson Plan
Math + Love = Valentine's Day Bar Graph
Second Grade
Data and Graphing
What's more romantic than a bar graph on Valentine's Day? In this Valentine's Day lesson plan, students will use information from a data set to create their own tally charts and bar graphs and then analyze these graphs to answer questions.
Lesson Plan
Math + Love = Valentine's Day Bar Graph
Lesson Plan
Math + Love = Valentine's Day Bar Graph
What's more romantic than a bar graph on Valentine's Day? In this Valentine's Day lesson plan, students will use information from a data set to create their own tally charts and bar graphs and then analyze these graphs to answer questions.
Second Grade
Data and Graphing
Lesson Plan
Leprechaun Chase
Activity
Leprechaun Chase
Third Grade
Geometry
This St. Patrick's day, stretch your third grader's social studies and math skills with this fun, cooperative learning game.
Activity
Leprechaun Chase
Activity
Leprechaun Chase
This St. Patrick's day, stretch your third grader's social studies and math skills with this fun, cooperative learning game.
Third Grade
Geometry
Activity
Track the Weather with Weather Charts
Activity
Track the Weather with Weather Charts
Third Grade
Measurement
Learn about the microclimate of your backyard by tracking rainfall, temperature, and observed weather with hand drawn charts and graphs.
Activity
Track the Weather with Weather Charts
Activity
Track the Weather with Weather Charts
Learn about the microclimate of your backyard by tracking rainfall, temperature, and observed weather with hand drawn charts and graphs.
Third Grade
Measurement
Activity
Mean, Median and Mode Madness!
Lesson Plan
Mean, Median and Mode Madness!
Third Grade
Data and Graphing
This lesson introduces students to the concepts of mean, median, and mode in a hands-on and visual way.
Lesson Plan
Mean, Median and Mode Madness!
Lesson Plan
Mean, Median and Mode Madness!
This lesson introduces students to the concepts of mean, median, and mode in a hands-on and visual way.
Third Grade
Data and Graphing
Lesson Plan
Graph My Design
Lesson Plan
Graph My Design
First Grade
Geometry
Geometry meets data in this fun lesson! Students will build a design using pattern blocks and then graph the number of each shape used. This scaffolded EL lesson can be used alone or alongside
Graphing Colored Counters.
Lesson Plan
Graph My Design
Lesson Plan
Graph My Design
Geometry meets data in this fun lesson! Students will build a design using pattern blocks and then graph the number of each shape used. This scaffolded EL lesson can be used alone or alongside
Graphing Colored Counters.
First Grade
Geometry
Lesson Plan
Summer Bar Graph
Activity
Summer Bar Graph
First Grade
Data and Graphing
Draw some educational value out of a summer stocked full of adventures!
Activity
Summer Bar Graph
Activity
Summer Bar Graph
Draw some educational value out of a summer stocked full of adventures!
First Grade
Data and Graphing
Activity
Subtraction Action
Activity
Subtraction Action
Third Grade
Data and Graphing
Most parents probably wouldn't mind subtracting 8-9 years off their age. Here's a fun third grade subtraction activity that may do just that.
Activity
Subtraction Action
Activity
Subtraction Action
Most parents probably wouldn't mind subtracting 8-9 years off their age. Here's a fun third grade subtraction activity that may do just that.
Third Grade
Data and Graphing
Activity
Game of Chance
Activity
Game of Chance
Third Grade
Data and Graphing
This fun math card game is a great opportunity to discuss probability with your third grader.
Activity
Game of Chance
Activity
Game of Chance
This fun math card game is a great opportunity to discuss probability with your third grader.
Third Grade
Data and Graphing
Activity
1
2
3
4
5