SKIP TO CONTENT
Worksheet Generator
Subjects
Grades
Worksheets
Games
Build a Worksheet
More Resources
Roly Recommends
Math Month
Subjects
Grades
Worksheets
Games
Build a Worksheet
More Resources
Roly Recommends
Math Month
All Subjects
Math
Data and Graphing
Subtopics:
Collecting and Organizing Data
Picture Graphs
Bar Graphs
Show Less
Filters
Search for: adding, mixed, number, like, denominators
✕
Math
✕
1st - 4th Grade
✕
Common Core
✕
Subjects
Math
English Language Arts
Science
Social Studies
Grade Level
Pre-K
K
1st
2nd
3rd
4th
5th
6th
7th
8th
Early Childhood
Elementary School
Middle School
Resource Type
Worksheets
Games
Lesson Plans
Workbooks
Activities
Occasion
Summer
Valentine's Day
Common Core
Yes
English Language Support
Yes
See More
Clear All
View 32 results
Showing Results for adding mixed number like denominators
32 results
Search for: adding, mixed, number, like, denominators
✕
Math
✕
1st - 4th Grade
✕
Common Core
✕
Clear All
Sort by:
Relevance
Most recent
Most popular
Alphabetical A-Z
Alphabetical Z-A
All filters
32 results
Sort by:
Relevance
Most recent
Most popular
Alphabetical A-Z
Alphabetical Z-A
Basic Pictographs
Worksheet
Basic Pictographs
First Grade
Data and Graphing
Practice adding multiple digits with a fun pictograph page. Use the chart to draw out the number of items in each problem.
Worksheet
Basic Pictographs
Worksheet
Basic Pictographs
Practice adding multiple digits with a fun pictograph page. Use the chart to draw out the number of items in each problem.
First Grade
Data and Graphing
Worksheet
Reading a Bar Graph: Number of Athletes
Worksheet
Reading a Bar Graph: Number of Athletes
Third Grade
Data and Graphing
In this sports-themed worksheet, children use a bar graph to answer six questions about the number of athletes playing at a time in a variety of sporting events.
Worksheet
Reading a Bar Graph: Number of Athletes
Worksheet
Reading a Bar Graph: Number of Athletes
In this sports-themed worksheet, children use a bar graph to answer six questions about the number of athletes playing at a time in a variety of sporting events.
Third Grade
Data and Graphing
Worksheet
Comparing Pictographs: Football Time
Worksheet
Comparing Pictographs: Football Time
Third Grade
Data and Graphing
In this math worksheet, kids compare two pictographs that record the number of footballs kicked and the number of footballs thrown on the field.
Worksheet
Comparing Pictographs: Football Time
Worksheet
Comparing Pictographs: Football Time
In this math worksheet, kids compare two pictographs that record the number of footballs kicked and the number of footballs thrown on the field.
Third Grade
Data and Graphing
Worksheet
Less Than or Greater Than: 1 to 20
Game
Less Than or Greater Than: 1 to 20
First Grade
Numbers and Counting
The alligators are hungry for numbers, and kids use number skills to feed them.
Game
Less Than or Greater Than: 1 to 20
Game
Less Than or Greater Than: 1 to 20
The alligators are hungry for numbers, and kids use number skills to feed them.
First Grade
Numbers and Counting
Game
Addition Picture Graphs
Worksheet
Addition Picture Graphs
First Grade
Data and Graphing
Explore some stellar math concepts with this worksheet on adding multiple digits. Fill in the pictograph to help you visualize the problem first.
Worksheet
Addition Picture Graphs
Worksheet
Addition Picture Graphs
Explore some stellar math concepts with this worksheet on adding multiple digits. Fill in the pictograph to help you visualize the problem first.
First Grade
Data and Graphing
Worksheet
Pictograph Practice: Hamburger Cafe
Worksheet
Pictograph Practice: Hamburger Cafe
Second Grade
Data and Graphing
Pictographs are a great introduction to working with data and graphs. Kids help the hamburger cafe compare the number of hamburgers they sold using pictographs.
Worksheet
Pictograph Practice: Hamburger Cafe
Worksheet
Pictograph Practice: Hamburger Cafe
Pictographs are a great introduction to working with data and graphs. Kids help the hamburger cafe compare the number of hamburgers they sold using pictographs.
Second Grade
Data and Graphing
Worksheet
Pictograph Graph: Mr. Postman
Worksheet
Pictograph Graph: Mr. Postman
Second Grade
Data and Graphing
Boost your child's data know-how with a lesson on reading and understanding a math pictograph, a kind of graph in which pictures stand in for number data.
Worksheet
Pictograph Graph: Mr. Postman
Worksheet
Pictograph Graph: Mr. Postman
Boost your child's data know-how with a lesson on reading and understanding a math pictograph, a kind of graph in which pictures stand in for number data.
Second Grade
Data and Graphing
Worksheet
What Do We Know About Siblings?
Worksheet
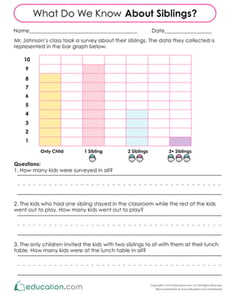
What Do We Know About Siblings?
First Grade
Data and Graphing
Your students will need to use the bar graph to complete the questions on this worksheet. Students will flex their math muscles by counting, adding, and problem solving.
Worksheet
What Do We Know About Siblings?
Worksheet
What Do We Know About Siblings?
Your students will need to use the bar graph to complete the questions on this worksheet. Students will flex their math muscles by counting, adding, and problem solving.
First Grade
Data and Graphing
Worksheet
What Do We Know About Vegetables?
Worksheet
What Do We Know About Vegetables?
First Grade
Data and Graphing
This math worksheet asks students to problem solve using data. Students will satisfy their math appetite by counting, adding, and problem solving using the vegetable data in a bar graph.
Worksheet
What Do We Know About Vegetables?
Worksheet
What Do We Know About Vegetables?
This math worksheet asks students to problem solve using data. Students will satisfy their math appetite by counting, adding, and problem solving using the vegetable data in a bar graph.
First Grade
Data and Graphing
Worksheet
Mean, Median and Mode Madness!
Lesson Plan
Mean, Median and Mode Madness!
Third Grade
Data and Graphing
This lesson introduces students to the concepts of mean, median, and mode in a hands-on and visual way.
Lesson Plan
Mean, Median and Mode Madness!
Lesson Plan
Mean, Median and Mode Madness!
This lesson introduces students to the concepts of mean, median, and mode in a hands-on and visual way.
Third Grade
Data and Graphing
Lesson Plan
Build a Bar Graph: Favorite Wild Animals
Worksheet
Build a Bar Graph: Favorite Wild Animals
Second Grade
Data and Graphing
Analyze a bar graph with this second-grade worksheet!
Worksheet
Build a Bar Graph: Favorite Wild Animals
Worksheet
Build a Bar Graph: Favorite Wild Animals
Analyze a bar graph with this second-grade worksheet!
Second Grade
Data and Graphing
Worksheet
Bar Graphs: Interpreting Data
Lesson Plan
Bar Graphs: Interpreting Data
Second Grade
Data and Graphing
In this lesson, students will make bar graphs and interpret data using real-life data from other students. They will get practice writing and answering survey questions.
Lesson Plan
Bar Graphs: Interpreting Data
Lesson Plan
Bar Graphs: Interpreting Data
In this lesson, students will make bar graphs and interpret data using real-life data from other students. They will get practice writing and answering survey questions.
Second Grade
Data and Graphing
Lesson Plan
Heart Hunt: Count and Graph
Worksheet
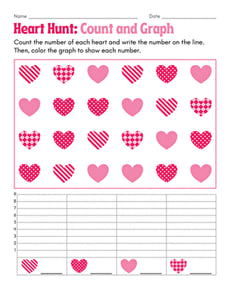
Heart Hunt: Count and Graph
Kindergarten
Numbers and Counting
Hunt for decorative hearts in this Valentine’s Day-themed graphing worksheet for kindergarteners and first graders!
Worksheet
Heart Hunt: Count and Graph
Worksheet
Heart Hunt: Count and Graph
Hunt for decorative hearts in this Valentine’s Day-themed graphing worksheet for kindergarteners and first graders!
Kindergarten
Numbers and Counting
Worksheet
Let's Play Ball
Lesson Plan
Let's Play Ball
Third Grade
Multiplication
Students will have a ball with this data collection lesson plan where they learn about collecting and plotting data on a chart and line plot.
Lesson Plan
Let's Play Ball
Lesson Plan
Let's Play Ball
Students will have a ball with this data collection lesson plan where they learn about collecting and plotting data on a chart and line plot.
Third Grade
Multiplication
Lesson Plan
Tally Time: At the Farmers Market
Worksheet
Tally Time: At the Farmers Market
First Grade
Data and Graphing
The farmer needs help keeping track of his vegetables. Can your child use her counting skills to give him a hand?
Worksheet
Tally Time: At the Farmers Market
Worksheet
Tally Time: At the Farmers Market
The farmer needs help keeping track of his vegetables. Can your child use her counting skills to give him a hand?
First Grade
Data and Graphing
Worksheet
Data and Graphing
Workbook
Data and Graphing
Third Grade
Data and Graphing
Become a master of analysis! In this series, kids practice collecting, creating and plotting data on graphs. Then they'll practice reading graphs, making predictions, and comparing data.
Workbook
Data and Graphing
Workbook
Data and Graphing
Become a master of analysis! In this series, kids practice collecting, creating and plotting data on graphs. Then they'll practice reading graphs, making predictions, and comparing data.
Third Grade
Data and Graphing
Workbook
Graphing Colored Counters
Lesson Plan
Graphing Colored Counters
Kindergarten
Data and Graphing
In this lesson, your students will use the background knowledge that they have about counting and sorting to graph data. They will practice answering questions about the graph!
Lesson Plan
Graphing Colored Counters
Lesson Plan
Graphing Colored Counters
In this lesson, your students will use the background knowledge that they have about counting and sorting to graph data. They will practice answering questions about the graph!
Kindergarten
Data and Graphing
Lesson Plan
Interpreting Line Plots with Fractional Units
Worksheet
Interpreting Line Plots with Fractional Units
Third Grade
Data and Graphing
In this third grade worksheet, kids will interpret a line plot that includes fractional units.
Worksheet
Interpreting Line Plots with Fractional Units
Worksheet
Interpreting Line Plots with Fractional Units
In this third grade worksheet, kids will interpret a line plot that includes fractional units.
Third Grade
Data and Graphing
Worksheet
Learning Charts
Worksheet
Learning Charts
First Grade
Data and Graphing
Take math practice to the beach with this intro to pictographs! Practice drawing each word problem on the chart.
Worksheet
Learning Charts
Worksheet
Learning Charts
Take math practice to the beach with this intro to pictographs! Practice drawing each word problem on the chart.
First Grade
Data and Graphing
Worksheet
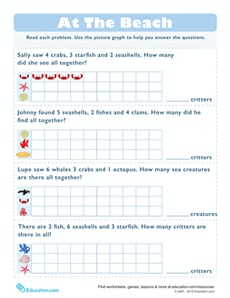
Graph the Critters
Worksheet
Graph the Critters
Second Grade
Data and Graphing
Give your second grader a fun way to practice basic arithmetic, and to practice making a graph with given information.
Worksheet
Graph the Critters
Worksheet
Graph the Critters
Give your second grader a fun way to practice basic arithmetic, and to practice making a graph with given information.
Second Grade
Data and Graphing
Worksheet
Math + Love = Valentine's Day Bar Graph
Lesson Plan
Math + Love = Valentine's Day Bar Graph
Second Grade
Data and Graphing
What's more romantic than a bar graph on Valentine's Day? In this Valentine's Day lesson plan, students will use information from a data set to create their own tally charts and bar graphs and then analyze these graphs to answer questions.
Lesson Plan
Math + Love = Valentine's Day Bar Graph
Lesson Plan
Math + Love = Valentine's Day Bar Graph
What's more romantic than a bar graph on Valentine's Day? In this Valentine's Day lesson plan, students will use information from a data set to create their own tally charts and bar graphs and then analyze these graphs to answer questions.
Second Grade
Data and Graphing
Lesson Plan
Introduction to Probability
Worksheet
Introduction to Probability
Fourth Grade
Data and Graphing
This bag of sports balls needs sorting! Introduce your child to probability concepts with this worksheet.
Worksheet
Introduction to Probability
Worksheet
Introduction to Probability
This bag of sports balls needs sorting! Introduce your child to probability concepts with this worksheet.
Fourth Grade
Data and Graphing
Worksheet
Make a Picture Graph
Worksheet
Make a Picture Graph
First Grade
Data and Graphing
In this math worksheet, children use picture graphs to tally up the total amounts of baked goods each party purchases.
Worksheet
Make a Picture Graph
Worksheet
Make a Picture Graph
In this math worksheet, children use picture graphs to tally up the total amounts of baked goods each party purchases.
First Grade
Data and Graphing
Worksheet
Reading Pictographs: Eggplant Cooking
Worksheet
Reading Pictographs: Eggplant Cooking
Third Grade
Data and Graphing
Mr. Chef keeps track of how many eggplants he uses with a pictograph. In this worksheet, kids use information in the pictograph to answer word problems.
Worksheet
Reading Pictographs: Eggplant Cooking
Worksheet
Reading Pictographs: Eggplant Cooking
Mr. Chef keeps track of how many eggplants he uses with a pictograph. In this worksheet, kids use information in the pictograph to answer word problems.
Third Grade
Data and Graphing
Worksheet
Picture Graphing with Fish
Game
Picture Graphing with Fish
Third Grade
Data and Graphing
Fish, fish everywhere! Kids catch fish to sort and graph in this zany game.
Game
Picture Graphing with Fish
Game
Picture Graphing with Fish
Fish, fish everywhere! Kids catch fish to sort and graph in this zany game.
Third Grade
Data and Graphing
Game
Bar Graphing with Eggs
Game
Bar Graphing with Eggs
Third Grade
Data and Graphing
It's raining eggs! Kids must move quickly to catch eggs for Farmer Brown, organizing and displaying the data using bar graphs in this silly game.
Game
Bar Graphing with Eggs
Game
Bar Graphing with Eggs
It's raining eggs! Kids must move quickly to catch eggs for Farmer Brown, organizing and displaying the data using bar graphs in this silly game.
Third Grade
Data and Graphing
Game
Using Election Data
Worksheet
Using Election Data
Second Grade
Data and Graphing
Practice reading election data with this data analysis worksheet!
Worksheet
Using Election Data
Worksheet
Using Election Data
Practice reading election data with this data analysis worksheet!
Second Grade
Data and Graphing
Worksheet
Why Do Leaves Change Color?
Activity
Why Do Leaves Change Color?
Second Grade
Data and Graphing
Engage your children with this fun fall activity that integrates math and science. First, your child will excavate to find leaves. Next, they'll examine them to determine the colors. Then, your child will graph their findings.
Activity
Why Do Leaves Change Color?
Activity
Why Do Leaves Change Color?
Engage your children with this fun fall activity that integrates math and science. First, your child will excavate to find leaves. Next, they'll examine them to determine the colors. Then, your child will graph their findings.
Second Grade
Data and Graphing
Activity
Let's Graph Our Fall Favorites!
Lesson Plan
Let's Graph Our Fall Favorites!
Second Grade
Data and Graphing
This engaging math lesson combines all of your kid's fall favorites as they learn to represent data using a bar graph.
Lesson Plan
Let's Graph Our Fall Favorites!
Lesson Plan
Let's Graph Our Fall Favorites!
This engaging math lesson combines all of your kid's fall favorites as they learn to represent data using a bar graph.
Second Grade
Data and Graphing
Lesson Plan
Picnic Bar Graph
Worksheet
Picnic Bar Graph
Second Grade
Data and Graphing
Which picnic games do you prefer? This bar graph shows some of the most popular picnic activities. Students will learn about analyzing data from a bar graph.
Worksheet
Picnic Bar Graph
Worksheet
Picnic Bar Graph
Which picnic games do you prefer? This bar graph shows some of the most popular picnic activities. Students will learn about analyzing data from a bar graph.
Second Grade
Data and Graphing
Worksheet
1
2