SKIP TO CONTENT
Worksheet Generator
Subjects
Grades
Worksheets
Games
Build a Worksheet
More Resources
Roly Recommends
Subjects
Grades
Worksheets
Games
Build a Worksheet
More Resources
Roly Recommends
All Subjects
Math
Data and Graphing
Subtopics:
Collecting and Organizing Data
Picture Graphs
Bar Graphs
Line Plots
Coordinate Plane
Show Less
Filters
Search for: daily, academic, grade, 6, weeks, 10, 18
✕
Math
✕
Worksheets
✕
Elementary School
✕
Subjects
Math
English Language Arts
Science
Social Studies
Foreign Language
Grade Level
Pre-K
K
1st
2nd
3rd
4th
5th
6th
7th
8th
Early Childhood
Elementary School
Middle School
Resource Type
Worksheets
Games
Lesson Plans
Interactive Worksheets
Activities
Offline Games
Guided Lessons
Teacher Resources
Occasion
Summer
Back to School
Holidays
Christmas
Valentine's Day
Common Core
Yes
See More
Clear All
View 118 results
Showing Results for daily academic grade 6 weeks 10 18
118 results
Search for: daily, academic, grade, 6, weeks, 10, 18
✕
Math
✕
Worksheets
✕
Elementary School
✕
Clear All
Sort by:
Relevance
Most recent
Most popular
Alphabetical A-Z
Alphabetical Z-A
All filters
118 results
Sort by:
Relevance
Most recent
Most popular
Alphabetical A-Z
Alphabetical Z-A
Using Base 10 Drawings in Two-Digit Addition
Worksheet
Using Base 10 Drawings in Two-Digit Addition
Second Grade
Addition
This worksheet teaches you to use base 10 drawings to add two-digit numbers.
Worksheet
Using Base 10 Drawings in Two-Digit Addition
Worksheet
Using Base 10 Drawings in Two-Digit Addition
This worksheet teaches you to use base 10 drawings to add two-digit numbers.
Second Grade
Addition
Worksheet
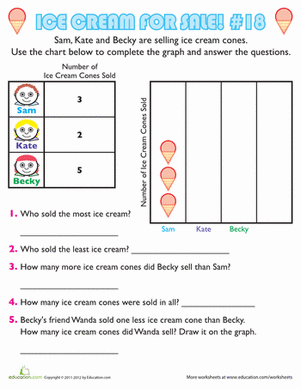
Ice Cream Graph #18
Worksheet
Ice Cream Graph #18
First Grade
Data and Graphing
Practice graphing data with Sam, Kate and Becky as they sell ice cream cones! Your child will keep track of their sales by drawing the data into a pictograph.
Worksheet
Ice Cream Graph #18
Worksheet
Ice Cream Graph #18
Practice graphing data with Sam, Kate and Becky as they sell ice cream cones! Your child will keep track of their sales by drawing the data into a pictograph.
First Grade
Data and Graphing
Worksheet
Ice Cream Bar Graph #6
Worksheet
Ice Cream Bar Graph #6
First Grade
Data and Graphing
Sam, Kate and Becky are having an ice cream sale. Help them keep track of their sales by filling in a bar graph, and then answer a few math questions.
Worksheet
Ice Cream Bar Graph #6
Worksheet
Ice Cream Bar Graph #6
Sam, Kate and Becky are having an ice cream sale. Help them keep track of their sales by filling in a bar graph, and then answer a few math questions.
First Grade
Data and Graphing
Worksheet
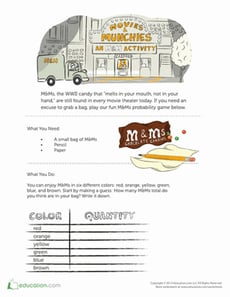
M&Ms Activity
Worksheet
M&Ms Activity
Fifth Grade
Data and Graphing
M&Ms come in six colors and lend themselves perfectly to a game of predictions and probability. Try to guess how many pieces of each color there are in a bag!
Worksheet
M&Ms Activity
Worksheet
M&Ms Activity
M&Ms come in six colors and lend themselves perfectly to a game of predictions and probability. Try to guess how many pieces of each color there are in a bag!
Fifth Grade
Data and Graphing
Worksheet
Reading a Bar Graph: Number of Athletes
Worksheet
Reading a Bar Graph: Number of Athletes
Third Grade
Data and Graphing
In this sports-themed worksheet, children use a bar graph to answer six questions about the number of athletes playing at a time in a variety of sporting events.
Worksheet
Reading a Bar Graph: Number of Athletes
Worksheet
Reading a Bar Graph: Number of Athletes
In this sports-themed worksheet, children use a bar graph to answer six questions about the number of athletes playing at a time in a variety of sporting events.
Third Grade
Data and Graphing
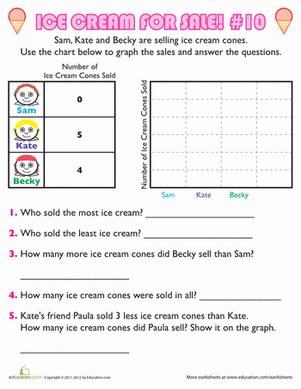
Worksheet
Ice Cream Bar Graph #10
Worksheet
Ice Cream Bar Graph #10
First Grade
Data and Graphing
Sam, Kate, and Becky need help keeping track of their ice cream sales. Practice using bar graphs, addition, and subtraction in this ice cream themed worksheet.
Worksheet
Ice Cream Bar Graph #10
Worksheet
Ice Cream Bar Graph #10
Sam, Kate, and Becky need help keeping track of their ice cream sales. Practice using bar graphs, addition, and subtraction in this ice cream themed worksheet.
First Grade
Data and Graphing
Worksheet
Build a Bar Graph: Favorite Wild Animals
Worksheet
Build a Bar Graph: Favorite Wild Animals
Second Grade
Data and Graphing
Analyze a bar graph with this second-grade worksheet!
Worksheet
Build a Bar Graph: Favorite Wild Animals
Worksheet
Build a Bar Graph: Favorite Wild Animals
Analyze a bar graph with this second-grade worksheet!
Second Grade
Data and Graphing
Worksheet
Measurement & Data Review
Worksheet
Measurement & Data Review
Fifth Grade
Fractions
Assess your students’ knowledge of fifth grade data and measurement concepts.
Worksheet
Measurement & Data Review
Worksheet
Measurement & Data Review
Assess your students’ knowledge of fifth grade data and measurement concepts.
Fifth Grade
Fractions
Worksheet
Interpreting Line Plots with Fractional Units
Worksheet
Interpreting Line Plots with Fractional Units
Third Grade
Data and Graphing
In this third grade worksheet, kids will interpret a line plot that includes fractional units.
Worksheet
Interpreting Line Plots with Fractional Units
Worksheet
Interpreting Line Plots with Fractional Units
In this third grade worksheet, kids will interpret a line plot that includes fractional units.
Third Grade
Data and Graphing
Worksheet
Using a Chart: Do Your Chores!
Worksheet
Using a Chart: Do Your Chores!
Third Grade
Data and Graphing
Kids completing this third grade math worksheet use a chart to compare data and solve addition problems.
Worksheet
Using a Chart: Do Your Chores!
Worksheet
Using a Chart: Do Your Chores!
Kids completing this third grade math worksheet use a chart to compare data and solve addition problems.
Third Grade
Data and Graphing
Worksheet
Foot Length: Create a Line Plot with Fractional Units
Worksheet
Foot Length: Create a Line Plot with Fractional Units
Fourth Grade
Data and Graphing
This worksheet challenges third graders to interpret the data and create a line plot with fractions, a key skill for fourth grade math.
Worksheet
Foot Length: Create a Line Plot with Fractional Units
Worksheet
Foot Length: Create a Line Plot with Fractional Units
This worksheet challenges third graders to interpret the data and create a line plot with fractions, a key skill for fourth grade math.
Fourth Grade
Data and Graphing
Worksheet
Practice Reading Venn Diagrams #3: Favorite Dessert
Worksheet
Practice Reading Venn Diagrams #3: Favorite Dessert
Second Grade
Data and Graphing
Kids practice reading a Venn diagram about favorite desserts and answer questions about it in this 2nd grade math worksheet.
Worksheet
Practice Reading Venn Diagrams #3: Favorite Dessert
Worksheet
Practice Reading Venn Diagrams #3: Favorite Dessert
Kids practice reading a Venn diagram about favorite desserts and answer questions about it in this 2nd grade math worksheet.
Second Grade
Data and Graphing
Worksheet
Reading Pictographs: Building a New Town
Worksheet
Reading Pictographs: Building a New Town
Third Grade
Data and Graphing
In this 3rd grade math worksheet, kids practice interpreting graph data and using information in a pictograph to answer word problems.
Worksheet
Reading Pictographs: Building a New Town
Worksheet
Reading Pictographs: Building a New Town
In this 3rd grade math worksheet, kids practice interpreting graph data and using information in a pictograph to answer word problems.
Third Grade
Data and Graphing
Worksheet
Practice Reading Venn Diagrams #1: Favorite Hobby
Worksheet
Practice Reading Venn Diagrams #1: Favorite Hobby
Second Grade
Data and Graphing
Kids practice reading a Venn diagram about favorite hobbies and answer questions about it in this 2nd grade math worksheet.
Worksheet
Practice Reading Venn Diagrams #1: Favorite Hobby
Worksheet
Practice Reading Venn Diagrams #1: Favorite Hobby
Kids practice reading a Venn diagram about favorite hobbies and answer questions about it in this 2nd grade math worksheet.
Second Grade
Data and Graphing
Worksheet
Comparing Pictographs: Taxi, Taxi
Worksheet
Comparing Pictographs: Taxi, Taxi
Third Grade
Addition
In this 3rd grade math worksheet, kids analyze and compare data in two pictographs in order to answer a set of word problems.
Worksheet
Comparing Pictographs: Taxi, Taxi
Worksheet
Comparing Pictographs: Taxi, Taxi
In this 3rd grade math worksheet, kids analyze and compare data in two pictographs in order to answer a set of word problems.
Third Grade
Addition
Worksheet
Practice Reading Venn Diagrams #2: In the Orchestra
Worksheet
Practice Reading Venn Diagrams #2: In the Orchestra
Second Grade
Data and Graphing
Kids practice reading a Venn diagram about instruments in an orchestra and answering questions about it in this 2nd grade math worksheet.
Worksheet
Practice Reading Venn Diagrams #2: In the Orchestra
Worksheet
Practice Reading Venn Diagrams #2: In the Orchestra
Kids practice reading a Venn diagram about instruments in an orchestra and answering questions about it in this 2nd grade math worksheet.
Second Grade
Data and Graphing
Worksheet
Reading Pictographs: Going to the Theater
Worksheet
Reading Pictographs: Going to the Theater
Third Grade
Data and Graphing
In this 3rd grade math worksheet, kids practice interpreting graph data as they use the information in a pictograph to answer a set of questions.
Worksheet
Reading Pictographs: Going to the Theater
Worksheet
Reading Pictographs: Going to the Theater
In this 3rd grade math worksheet, kids practice interpreting graph data as they use the information in a pictograph to answer a set of questions.
Third Grade
Data and Graphing
Worksheet
Bar Graph: Getting to School
Worksheet
Bar Graph: Getting to School
Third Grade
Data and Graphing
Kids completing this third grade math worksheet use a bar graph to compare data about transportation to school and solve addition and subtraction problems.
Worksheet
Bar Graph: Getting to School
Worksheet
Bar Graph: Getting to School
Kids completing this third grade math worksheet use a bar graph to compare data about transportation to school and solve addition and subtraction problems.
Third Grade
Data and Graphing
Worksheet
Make a Venn Diagram: Gift Boxes
Worksheet
Make a Venn Diagram: Gift Boxes
Second Grade
Data and Graphing
Kids practice making a Venn diagram about kinds of gift wrap by sorting the gifts in their correct spaces in this 2nd grade math worksheet.
Worksheet
Make a Venn Diagram: Gift Boxes
Worksheet
Make a Venn Diagram: Gift Boxes
Kids practice making a Venn diagram about kinds of gift wrap by sorting the gifts in their correct spaces in this 2nd grade math worksheet.
Second Grade
Data and Graphing
Worksheet
Go Runners! Practice Reading a Bar Graph
Worksheet
Go Runners! Practice Reading a Bar Graph
Third Grade
Data and Graphing
Your child will practice reading and interpreting a bar graph and using its data to answer a set of questions in this 3rd grade math worksheet.
Worksheet
Go Runners! Practice Reading a Bar Graph
Worksheet
Go Runners! Practice Reading a Bar Graph
Your child will practice reading and interpreting a bar graph and using its data to answer a set of questions in this 3rd grade math worksheet.
Third Grade
Data and Graphing
Worksheet
Juice Time: Practice Reading a Bar Graph
Worksheet
Juice Time: Practice Reading a Bar Graph
Third Grade
Data and Graphing
In this 3rd grade math worksheet, your child will practice reading a bar graph about juice and interpreting its information to answer a set of questions.
Worksheet
Juice Time: Practice Reading a Bar Graph
Worksheet
Juice Time: Practice Reading a Bar Graph
In this 3rd grade math worksheet, your child will practice reading a bar graph about juice and interpreting its information to answer a set of questions.
Third Grade
Data and Graphing
Worksheet
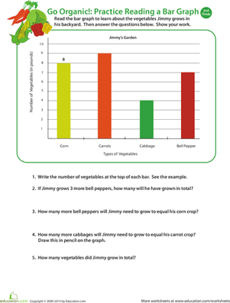
Go Organic! Practice Reading a Bar Graph
Worksheet
Go Organic! Practice Reading a Bar Graph
Second Grade
Data and Graphing
Boost your child's analytical thinking skills with this 2nd grade math worksheet in which he'll use data from a bar graph to answer word problems.
Worksheet
Go Organic! Practice Reading a Bar Graph
Worksheet
Go Organic! Practice Reading a Bar Graph
Boost your child's analytical thinking skills with this 2nd grade math worksheet in which he'll use data from a bar graph to answer word problems.
Second Grade
Data and Graphing
Worksheet
Create a Line Plot with Data Provided
Worksheet
Create a Line Plot with Data Provided
Third Grade
Data and Graphing
Use the data provided to have your students create a line plot that reflects how much TV watched per week for one third grade class.
Worksheet
Create a Line Plot with Data Provided
Worksheet
Create a Line Plot with Data Provided
Use the data provided to have your students create a line plot that reflects how much TV watched per week for one third grade class.
Third Grade
Data and Graphing
Worksheet
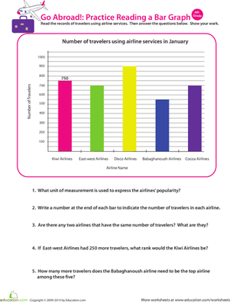
Going Abroad: Practice Reading a Bar Graph
Worksheet
Going Abroad: Practice Reading a Bar Graph
Fourth Grade
Data and Graphing
This 4th grade math worksheet will challenge your child's analytical thinking skills. He'll read a bar graph, then use its data to answer a set of questions.
Worksheet
Going Abroad: Practice Reading a Bar Graph
Worksheet
Going Abroad: Practice Reading a Bar Graph
This 4th grade math worksheet will challenge your child's analytical thinking skills. He'll read a bar graph, then use its data to answer a set of questions.
Fourth Grade
Data and Graphing
Worksheet
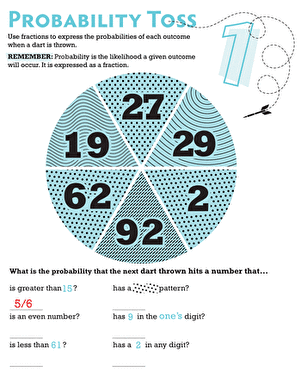
Probability Toss 1
Worksheet
Probability Toss 1
Fifth Grade
Data and Graphing
What are the chances that a dart will land on an even number on a dart board? Find out in this sixth grade probability worksheet!
Worksheet
Probability Toss 1
Worksheet
Probability Toss 1
What are the chances that a dart will land on an even number on a dart board? Find out in this sixth grade probability worksheet!
Fifth Grade
Data and Graphing
Worksheet
Reading Pictographs: Drink Your Milk!
Worksheet
Reading Pictographs: Drink Your Milk!
Third Grade
Data and Graphing
Can your child help Tommy figure out how much milk he drinks? As she does, she'll learn how to read and interpret data in graphs and practice multiplication.
Worksheet
Reading Pictographs: Drink Your Milk!
Worksheet
Reading Pictographs: Drink Your Milk!
Can your child help Tommy figure out how much milk he drinks? As she does, she'll learn how to read and interpret data in graphs and practice multiplication.
Third Grade
Data and Graphing
Worksheet
Pictograph Practice: Hamburger Cafe
Worksheet
Pictograph Practice: Hamburger Cafe
Second Grade
Data and Graphing
Pictographs are a great introduction to working with data and graphs. Kids help the hamburger cafe compare the number of hamburgers they sold using pictographs.
Worksheet
Pictograph Practice: Hamburger Cafe
Worksheet
Pictograph Practice: Hamburger Cafe
Pictographs are a great introduction to working with data and graphs. Kids help the hamburger cafe compare the number of hamburgers they sold using pictographs.
Second Grade
Data and Graphing
Worksheet
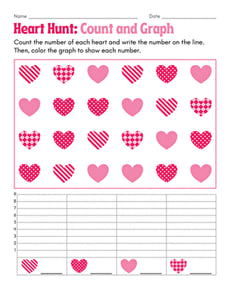
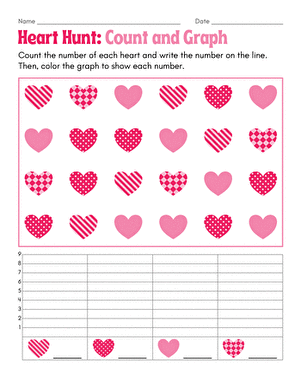
Heart Hunt: Count and Graph
Worksheet
Heart Hunt: Count and Graph
Kindergarten
Numbers and Counting
Hunt for decorative hearts in this Valentine’s Day-themed graphing worksheet for kindergarteners and first graders!
Worksheet
Heart Hunt: Count and Graph
Worksheet
Heart Hunt: Count and Graph
Hunt for decorative hearts in this Valentine’s Day-themed graphing worksheet for kindergarteners and first graders!
Kindergarten
Numbers and Counting
Worksheet
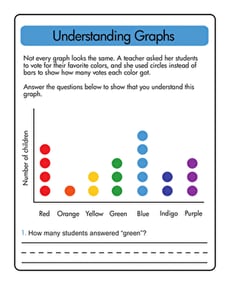
Understanding Graphs
Worksheet
Understanding Graphs
First Grade
Data and Graphing
Test your first grader's understanding of graphs and the information they provide with this worksheet.
Worksheet
Understanding Graphs
Worksheet
Understanding Graphs
Test your first grader's understanding of graphs and the information they provide with this worksheet.
First Grade
Data and Graphing
Worksheet
Ski Trail Tracker #8
Worksheet
Ski Trail Tracker #8
Fifth Grade
Data and Graphing
Show your fifth grader how to practice geometry and division sporty style with this fun math worksheet!
Worksheet
Ski Trail Tracker #8
Worksheet
Ski Trail Tracker #8
Show your fifth grader how to practice geometry and division sporty style with this fun math worksheet!
Fifth Grade
Data and Graphing
Worksheet
1
2
3
4