SKIP TO CONTENT
Worksheet Generator
Subjects
Grades
Worksheets
Games
Build a Worksheet
More Resources
Roly Recommends
Subjects
Grades
Worksheets
Games
Build a Worksheet
More Resources
Roly Recommends
All Subjects
Math
Data and Graphing
Subtopics:
Collecting and Organizing Data
Picture Graphs
Bar Graphs
Line Plots
Coordinate Plane
Show Less
Filters
Search for: word, structure, 1
✕
Math
✕
Elementary School
✕
Common Core
✕
Subjects
Math
English Language Arts
Science
Social Studies
Grade Level
Pre-K
K
1st
2nd
3rd
4th
5th
6th
7th
8th
Early Childhood
Elementary School
Middle School
Resource Type
Worksheets
Games
Lesson Plans
Interactive Worksheets
Activities
Exercises
Occasion
Easter
Earth Day
Back to School
Halloween
Holidays
Common Core
Yes
English Language Support
Yes
See More
Clear All
View 67 results
Showing Results for word structure 1 : Page 2
67 results
Search for: word, structure, 1
✕
Math
✕
Elementary School
✕
Common Core
✕
Clear All
Sort by:
Relevance
Most recent
Most popular
Alphabetical A-Z
Alphabetical Z-A
All filters
67 results
Sort by:
Relevance
Most recent
Most popular
Alphabetical A-Z
Alphabetical Z-A
Reading Pictographs: Going to the Theater
Worksheet
Reading Pictographs: Going to the Theater
Third Grade
Data and Graphing
In this 3rd grade math worksheet, kids practice interpreting graph data as they use the information in a pictograph to answer a set of questions.
Worksheet
Reading Pictographs: Going to the Theater
Worksheet
Reading Pictographs: Going to the Theater
In this 3rd grade math worksheet, kids practice interpreting graph data as they use the information in a pictograph to answer a set of questions.
Third Grade
Data and Graphing
Worksheet
Reading Pictographs: Tomato Fest!
Worksheet
Reading Pictographs: Tomato Fest!
Third Grade
Data and Graphing
The farmers are busy picking tomatoes! Kids practice reading a pictograph to help Mr. Farmer figure out how many tomatoes he picked in this worksheet.
Worksheet
Reading Pictographs: Tomato Fest!
Worksheet
Reading Pictographs: Tomato Fest!
The farmers are busy picking tomatoes! Kids practice reading a pictograph to help Mr. Farmer figure out how many tomatoes he picked in this worksheet.
Third Grade
Data and Graphing
Worksheet
Go Runners! Practice Reading a Bar Graph
Worksheet
Go Runners! Practice Reading a Bar Graph
Third Grade
Data and Graphing
Your child will practice reading and interpreting a bar graph and using its data to answer a set of questions in this 3rd grade math worksheet.
Worksheet
Go Runners! Practice Reading a Bar Graph
Worksheet
Go Runners! Practice Reading a Bar Graph
Your child will practice reading and interpreting a bar graph and using its data to answer a set of questions in this 3rd grade math worksheet.
Third Grade
Data and Graphing
Worksheet
Juice Time: Practice Reading a Bar Graph
Worksheet
Juice Time: Practice Reading a Bar Graph
Third Grade
Data and Graphing
In this 3rd grade math worksheet, your child will practice reading a bar graph about juice and interpreting its information to answer a set of questions.
Worksheet
Juice Time: Practice Reading a Bar Graph
Worksheet
Juice Time: Practice Reading a Bar Graph
In this 3rd grade math worksheet, your child will practice reading a bar graph about juice and interpreting its information to answer a set of questions.
Third Grade
Data and Graphing
Worksheet
Reading Pictographs: Drink Your Milk!
Worksheet
Reading Pictographs: Drink Your Milk!
Third Grade
Data and Graphing
Can your child help Tommy figure out how much milk he drinks? As she does, she'll learn how to read and interpret data in graphs and practice multiplication.
Worksheet
Reading Pictographs: Drink Your Milk!
Worksheet
Reading Pictographs: Drink Your Milk!
Can your child help Tommy figure out how much milk he drinks? As she does, she'll learn how to read and interpret data in graphs and practice multiplication.
Third Grade
Data and Graphing
Worksheet
Comparing Pictographs: Football Time
Worksheet
Comparing Pictographs: Football Time
Third Grade
Data and Graphing
In this math worksheet, kids compare two pictographs that record the number of footballs kicked and the number of footballs thrown on the field.
Worksheet
Comparing Pictographs: Football Time
Worksheet
Comparing Pictographs: Football Time
In this math worksheet, kids compare two pictographs that record the number of footballs kicked and the number of footballs thrown on the field.
Third Grade
Data and Graphing
Worksheet
Let's Graph Our Fall Favorites!
Lesson Plan
Let's Graph Our Fall Favorites!
Second Grade
Data and Graphing
This engaging math lesson combines all of your kid's fall favorites as they learn to represent data using a bar graph.
Lesson Plan
Let's Graph Our Fall Favorites!
Lesson Plan
Let's Graph Our Fall Favorites!
This engaging math lesson combines all of your kid's fall favorites as they learn to represent data using a bar graph.
Second Grade
Data and Graphing
Lesson Plan
What Do We Know About Pets?
Worksheet
What Do We Know About Pets?
First Grade
Data and Graphing
Ms. Martin collected data about her class' favorite pets. Ask your students to use the bar graph with Ms. Martin's findings to answer the questions on the worksheet.
Worksheet
What Do We Know About Pets?
Worksheet
What Do We Know About Pets?
Ms. Martin collected data about her class' favorite pets. Ask your students to use the bar graph with Ms. Martin's findings to answer the questions on the worksheet.
First Grade
Data and Graphing
Worksheet
Graphing Colored Counters
Lesson Plan
Graphing Colored Counters
Kindergarten
Data and Graphing
In this lesson, your students will use the background knowledge that they have about counting and sorting to graph data. They will practice answering questions about the graph!
Lesson Plan
Graphing Colored Counters
Lesson Plan
Graphing Colored Counters
In this lesson, your students will use the background knowledge that they have about counting and sorting to graph data. They will practice answering questions about the graph!
Kindergarten
Data and Graphing
Lesson Plan
Basic Pictographs
Worksheet
Basic Pictographs
First Grade
Data and Graphing
Practice adding multiple digits with a fun pictograph page. Use the chart to draw out the number of items in each problem.
Worksheet
Basic Pictographs
Worksheet
Basic Pictographs
Practice adding multiple digits with a fun pictograph page. Use the chart to draw out the number of items in each problem.
First Grade
Data and Graphing
Worksheet
Donut Data
Worksheet
Donut Data
Fifth Grade
Data and Graphing
Practice using line plots and data sets to solve math problems with this donut-themed fractions worksheet!
Worksheet
Donut Data
Worksheet
Donut Data
Practice using line plots and data sets to solve math problems with this donut-themed fractions worksheet!
Fifth Grade
Data and Graphing
Worksheet
Addition Picture Graphs
Worksheet
Addition Picture Graphs
First Grade
Data and Graphing
Explore some stellar math concepts with this worksheet on adding multiple digits. Fill in the pictograph to help you visualize the problem first.
Worksheet
Addition Picture Graphs
Worksheet
Addition Picture Graphs
Explore some stellar math concepts with this worksheet on adding multiple digits. Fill in the pictograph to help you visualize the problem first.
First Grade
Data and Graphing
Worksheet
Organize the Campsite
Worksheet
Organize the Campsite
Kindergarten
Data and Graphing
In this kindergarten math worksheet, group together each campers' belongings then count the number of groups to find out how many campers there are.
Worksheet
Organize the Campsite
Worksheet
Organize the Campsite
In this kindergarten math worksheet, group together each campers' belongings then count the number of groups to find out how many campers there are.
Kindergarten
Data and Graphing
Worksheet
Count the Tree Rings
Worksheet
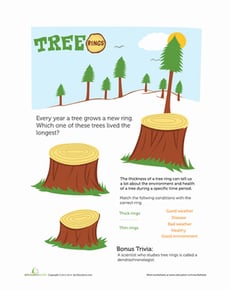
Count the Tree Rings
Kindergarten
Numbers and Counting
This printable will help your child with their observation skills by challenging them to count the tree rings to determine their ages.
Worksheet
Count the Tree Rings
Worksheet
Count the Tree Rings
This printable will help your child with their observation skills by challenging them to count the tree rings to determine their ages.
Kindergarten
Numbers and Counting
Worksheet
More or Less: Practice Comparing Numbers
Worksheet
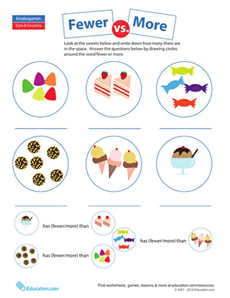
More or Less: Practice Comparing Numbers
Kindergarten
Numbers and Counting
Introduce your child to basic inequalities with this worksheet that challenges him to count up the objects in each group and decide which has fewer or more.
Worksheet
More or Less: Practice Comparing Numbers
Worksheet
More or Less: Practice Comparing Numbers
Introduce your child to basic inequalities with this worksheet that challenges him to count up the objects in each group and decide which has fewer or more.
Kindergarten
Numbers and Counting
Worksheet
Pictographs: Say Cheese!
Worksheet
Pictographs: Say Cheese!
Third Grade
Data and Graphing
To keep track of his cheese sales, Giovanni uses a pictograph. Kids will figure out how his cheese business is doing by using data in the graph.
Worksheet
Pictographs: Say Cheese!
Worksheet
Pictographs: Say Cheese!
To keep track of his cheese sales, Giovanni uses a pictograph. Kids will figure out how his cheese business is doing by using data in the graph.
Third Grade
Data and Graphing
Worksheet
Winter Sports: Practice Reading a Bar Graph
Worksheet
Winter Sports: Practice Reading a Bar Graph
Second Grade
Data and Graphing
Children will practice interpreting a bar graph in this winter sports–themed math worksheet.
Worksheet
Winter Sports: Practice Reading a Bar Graph
Worksheet
Winter Sports: Practice Reading a Bar Graph
Children will practice interpreting a bar graph in this winter sports–themed math worksheet.
Second Grade
Data and Graphing
Worksheet
Bar Graph: Getting to School
Worksheet
Bar Graph: Getting to School
Third Grade
Data and Graphing
Kids completing this third grade math worksheet use a bar graph to compare data about transportation to school and solve addition and subtraction problems.
Worksheet
Bar Graph: Getting to School
Worksheet
Bar Graph: Getting to School
Kids completing this third grade math worksheet use a bar graph to compare data about transportation to school and solve addition and subtraction problems.
Third Grade
Data and Graphing
Worksheet
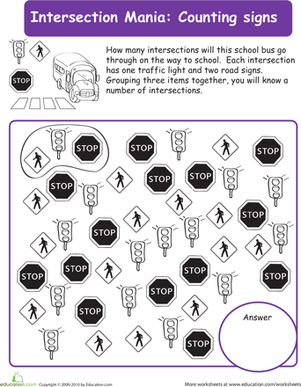
Count the Traffic Signs
Worksheet
Count the Traffic Signs
Kindergarten
Data and Graphing
Find out how many intersections the school bus goes through in this kindergarten math worksheet that helps your child practice grouping and counting.
Worksheet
Count the Traffic Signs
Worksheet
Count the Traffic Signs
Find out how many intersections the school bus goes through in this kindergarten math worksheet that helps your child practice grouping and counting.
Kindergarten
Data and Graphing
Worksheet
What is it Telling Me? Creating and Interpreting Line Plots
Lesson Plan
What is it Telling Me? Creating and Interpreting Line Plots
Third Grade
Data and Graphing
Line plots are a great way to introduce your students to graphing data. In this lesson, your students will learn how to create a line plot and also practice interpreting line plots.
Lesson Plan
What is it Telling Me? Creating and Interpreting Line Plots
Lesson Plan
What is it Telling Me? Creating and Interpreting Line Plots
Line plots are a great way to introduce your students to graphing data. In this lesson, your students will learn how to create a line plot and also practice interpreting line plots.
Third Grade
Data and Graphing
Lesson Plan
Math + Love = Valentine's Day Bar Graph
Lesson Plan
Math + Love = Valentine's Day Bar Graph
Second Grade
Data and Graphing
What's more romantic than a bar graph on Valentine's Day? In this Valentine's Day lesson plan, students will use information from a data set to create their own tally charts and bar graphs and then analyze these graphs to answer questions.
Lesson Plan
Math + Love = Valentine's Day Bar Graph
Lesson Plan
Math + Love = Valentine's Day Bar Graph
What's more romantic than a bar graph on Valentine's Day? In this Valentine's Day lesson plan, students will use information from a data set to create their own tally charts and bar graphs and then analyze these graphs to answer questions.
Second Grade
Data and Graphing
Lesson Plan
How Do You Measure Up?
Worksheet
How Do You Measure Up?
Fifth Grade
Fractions
Students will take practice measurements of real world objects and make a line plot of the data.
Worksheet
How Do You Measure Up?
Worksheet
How Do You Measure Up?
Students will take practice measurements of real world objects and make a line plot of the data.
Fifth Grade
Fractions
Worksheet
What Doesn't Belong? Quiz
Game
What Doesn't Belong? Quiz
Kindergarten
Data and Graphing
Kids must find the item that doesn't belong in this categorizing quiz.
Game
What Doesn't Belong? Quiz
Game
What Doesn't Belong? Quiz
Kids must find the item that doesn't belong in this categorizing quiz.
Kindergarten
Data and Graphing
Game
Spot the Difference 2
Game
Spot the Difference 2
Kindergarten
Data and Graphing
Game
Spot the Difference 2
Game
Spot the Difference 2
Kindergarten
Data and Graphing
Game
Picnic Color Sorting
Game
Picnic Color Sorting
Kindergarten
Data and Graphing
Kids sort items according to color and determine which number of items is greater.
Game
Picnic Color Sorting
Game
Picnic Color Sorting
Kids sort items according to color and determine which number of items is greater.
Kindergarten
Data and Graphing
Game
Finding Quarters
Worksheet
Finding Quarters
Kindergarten
Numbers and Counting
Little coin counters can have fun finding quarters in this money math sheet! Pick out the quarters from the group of coins.
Worksheet
Finding Quarters
Worksheet
Finding Quarters
Little coin counters can have fun finding quarters in this money math sheet! Pick out the quarters from the group of coins.
Kindergarten
Numbers and Counting
Worksheet
Practice Graphs
Worksheet
Practice Graphs
Second Grade
Data and Graphing
Kids practice representing a set of data using three kinds of graphs: a bar graph, pictograph, and pie graph.
Worksheet
Practice Graphs
Worksheet
Practice Graphs
Kids practice representing a set of data using three kinds of graphs: a bar graph, pictograph, and pie graph.
Second Grade
Data and Graphing
Worksheet
Mean, Median and Mode Madness!
Lesson Plan
Mean, Median and Mode Madness!
Third Grade
Data and Graphing
This lesson introduces students to the concepts of mean, median, and mode in a hands-on and visual way.
Lesson Plan
Mean, Median and Mode Madness!
Lesson Plan
Mean, Median and Mode Madness!
This lesson introduces students to the concepts of mean, median, and mode in a hands-on and visual way.
Third Grade
Data and Graphing
Lesson Plan
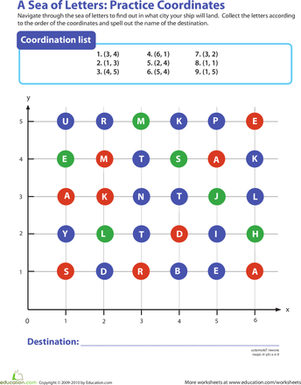
Coordinate Grid: A Sea of Letters
Worksheet
Coordinate Grid: A Sea of Letters
Fourth Grade
Geometry
Challenge your fourth grader to navigate through the sea of letters according to each coordinate to spell out a destination city's name.
Worksheet
Coordinate Grid: A Sea of Letters
Worksheet
Coordinate Grid: A Sea of Letters
Challenge your fourth grader to navigate through the sea of letters according to each coordinate to spell out a destination city's name.
Fourth Grade
Geometry
Worksheet
Mystery Picture Graph: All Hallow's Eve
Worksheet
Mystery Picture Graph: All Hallow's Eve
Fifth Grade
Geometry
The coordinate plane just got a little spookier! Can you graph these coordinates to reveal the hidden picture?
Worksheet
Mystery Picture Graph: All Hallow's Eve
Worksheet
Mystery Picture Graph: All Hallow's Eve
The coordinate plane just got a little spookier! Can you graph these coordinates to reveal the hidden picture?
Fifth Grade
Geometry
Worksheet
1
2
3