SKIP TO CONTENT
Worksheet Generator
Subjects
Grades
Worksheets
Games
Build a Worksheet
More Resources
Roly Recommends
Subjects
Grades
Worksheets
Games
Build a Worksheet
More Resources
Roly Recommends
Filters
Search for: results, in, interpreting, data
✕
Subjects
Math
English Language Arts
Science
Social Studies
Foreign Language
Grade Level
Pre-K
K
1st
2nd
3rd
4th
5th
6th
7th
8th
Early Childhood
Elementary School
Middle School
Resource Type
Worksheets
Games
Lesson Plans
Interactive Worksheets
Workbooks
Activities
Exercises
Songs
Offline Games
Guided Lessons
Teacher Resources
See more
Occasion
Birthdays
Women's History Month
St. Patrick's Day
Spring
Easter
Earth Day
Mother's Day
Memorial Day
Summer
Independence Day
Back to School
Fall
Halloween
Veterans Day
Winter
Holidays
Thanksgiving
Christmas
Hanukkah
Martin Luther King Jr. Day
Valentine's Day
Black History Month
See more
Common Core
Yes
No
Roly Recommends
Social Emotional Learning
Game Type
Ball Games
Group Games
Memory Games
Outdoor Games
Printable Board Games
Puzzles & Sudoku
Travel Games
Word Puzzles
Arts & Crafts
Arts & Crafts
Fabric Projects
Beads & Jewelry
Paper & Glue Crafts
Construction & Sculpture
Painting & Drawing
Recycled Crafts
Coloring
Yes
Recipes
Snacks
Mains
Sides
English Language Support
Yes
See More
Clear All
View 1,930 results
Showing Results for results in interpreting data : Page 5
1,930 results
Search for: results, in, interpreting, data
✕
Sort by:
Relevance
Most recent
Most popular
Alphabetical A-Z
Alphabetical Z-A
All filters
1,930 results
Sort by:
Relevance
Most recent
Most popular
Alphabetical A-Z
Alphabetical Z-A
Summer Hobbies Venn Diagram
Worksheet
Summer Hobbies Venn Diagram
Second Grade
Data and Graphing
Practice reading Venn diagrams with some of the most popular summertime hobbies. Your child will learn to analyze and interpret data by answering questions.
Worksheet
Summer Hobbies Venn Diagram
Worksheet
Summer Hobbies Venn Diagram
Practice reading Venn diagrams with some of the most popular summertime hobbies. Your child will learn to analyze and interpret data by answering questions.
Second Grade
Data and Graphing
Worksheet
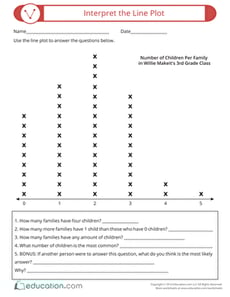
Interpret the Line Plot
Worksheet
Interpret the Line Plot
Second Grade
Data and Graphing
Students will get important practice analyzing line plots in this graphing and data worksheet.
Worksheet
Interpret the Line Plot
Worksheet
Interpret the Line Plot
Students will get important practice analyzing line plots in this graphing and data worksheet.
Second Grade
Data and Graphing
Worksheet
Pick a Flower Pictograph
Worksheet
Pick a Flower Pictograph
Second Grade
Data and Graphing
Find out exactly how many flowers Stefanie has planted with this pictograph for kids. Your child will learn how to analyze and interpret data.
Worksheet
Pick a Flower Pictograph
Worksheet
Pick a Flower Pictograph
Find out exactly how many flowers Stefanie has planted with this pictograph for kids. Your child will learn how to analyze and interpret data.
Second Grade
Data and Graphing
Worksheet
Measurement and Graphing 1
Exercise
Measurement and Graphing 1
Third Grade
Fractions
This exercise will introduce students to the concept of taking measurements and graphing the data.
Exercise
Measurement and Graphing 1
Exercise
Measurement and Graphing 1
This exercise will introduce students to the concept of taking measurements and graphing the data.
Third Grade
Fractions
Exercise
Describing Distributions in Histograms
Worksheet
Describing Distributions in Histograms
Sixth Grade
Data and Graphing
Help students deepen their understanding of histograms with this this two-page data and graphing worksheet!
Worksheet
Describing Distributions in Histograms
Worksheet
Describing Distributions in Histograms
Help students deepen their understanding of histograms with this this two-page data and graphing worksheet!
Sixth Grade
Data and Graphing
Worksheet
Beginning Bar Graphs: Favorite Sports
Worksheet
Beginning Bar Graphs: Favorite Sports
First Grade
Data and Graphing
This worksheet is a fun, hands on way to practice beginning data and graphing skills.
Worksheet
Beginning Bar Graphs: Favorite Sports
Worksheet
Beginning Bar Graphs: Favorite Sports
This worksheet is a fun, hands on way to practice beginning data and graphing skills.
First Grade
Data and Graphing
Worksheet
Comparing Pictographs: Tulips and Daisies
Worksheet
Comparing Pictographs: Tulips and Daisies
Second Grade
Data and Graphing
Your child will use the data in two pictographs that show the number of tulips and daisies imported from certain European countries to answer word problems.
Worksheet
Comparing Pictographs: Tulips and Daisies
Worksheet
Comparing Pictographs: Tulips and Daisies
Your child will use the data in two pictographs that show the number of tulips and daisies imported from certain European countries to answer word problems.
Second Grade
Data and Graphing
Worksheet
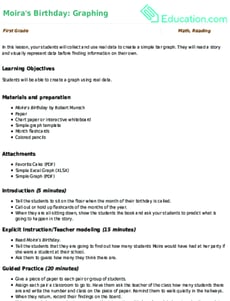
Moira's Birthday: Graphing
Lesson Plan
Moira's Birthday: Graphing
First Grade
In this lesson, your students will collect and use real data to create a simple bar graph. They will read a story and visually represent data before finding information on their own.
Lesson Plan
Moira's Birthday: Graphing
Lesson Plan
Moira's Birthday: Graphing
In this lesson, your students will collect and use real data to create a simple bar graph. They will read a story and visually represent data before finding information on their own.
First Grade
Lesson Plan
Creating Histograms From Frequency Tables
Worksheet
Creating Histograms From Frequency Tables
Sixth Grade
Data and Graphing
Practice using histograms to show different sets of data in this engaging sixth-grade worksheet!
Worksheet
Creating Histograms From Frequency Tables
Worksheet
Creating Histograms From Frequency Tables
Practice using histograms to show different sets of data in this engaging sixth-grade worksheet!
Sixth Grade
Data and Graphing
Worksheet
Ocean Lake River Questions
Worksheet
Ocean Lake River Questions
Second Grade
Data and Graphing
Do you prefer rivers, oceans, or lakes? Students will practice coming up with questions by analyzing the data given in this Venn diagram.
Worksheet
Ocean Lake River Questions
Worksheet
Ocean Lake River Questions
Do you prefer rivers, oceans, or lakes? Students will practice coming up with questions by analyzing the data given in this Venn diagram.
Second Grade
Data and Graphing
Worksheet
Bar Graph: Getting to School
Worksheet
Bar Graph: Getting to School
Third Grade
Data and Graphing
Kids completing this third grade math worksheet use a bar graph to compare data about transportation to school and solve addition and subtraction problems.
Worksheet
Bar Graph: Getting to School
Worksheet
Bar Graph: Getting to School
Kids completing this third grade math worksheet use a bar graph to compare data about transportation to school and solve addition and subtraction problems.
Third Grade
Data and Graphing
Worksheet
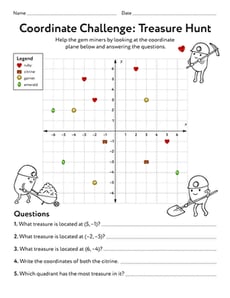
Coordinate Challenge: Treasure Hunt!
Worksheet
Coordinate Challenge: Treasure Hunt!
Sixth Grade
Data and Graphing
Sixth graders will mine four quadrants for gems in this data and graphing worksheet.
Worksheet
Coordinate Challenge: Treasure Hunt!
Worksheet
Coordinate Challenge: Treasure Hunt!
Sixth graders will mine four quadrants for gems in this data and graphing worksheet.
Sixth Grade
Data and Graphing
Worksheet
Mean Absolute Deviation
Worksheet
Mean Absolute Deviation
Sixth Grade
Data and Graphing
Students calculate the mean absolute deviation of data sets in this sixth-grade date and graphing worksheet.
Worksheet
Mean Absolute Deviation
Worksheet
Mean Absolute Deviation
Students calculate the mean absolute deviation of data sets in this sixth-grade date and graphing worksheet.
Sixth Grade
Data and Graphing
Worksheet
Design an Experiment Part 3: Draw a Conclusion
Worksheet
Design an Experiment Part 3: Draw a Conclusion
Sixth Grade
Engineering and Science Inquiry
With your experiment data and analysis in hand, it’s time to draw your conclusions!
Worksheet
Design an Experiment Part 3: Draw a Conclusion
Worksheet
Design an Experiment Part 3: Draw a Conclusion
With your experiment data and analysis in hand, it’s time to draw your conclusions!
Sixth Grade
Engineering and Science Inquiry
Worksheet
Bike Pictograph Questions
Worksheet
Bike Pictograph Questions
Second Grade
Data and Graphing
With these pictograph questions, your kid will hone his skills at reading and interpreting graphs.
Worksheet
Bike Pictograph Questions
Worksheet
Bike Pictograph Questions
With these pictograph questions, your kid will hone his skills at reading and interpreting graphs.
Second Grade
Data and Graphing
Worksheet
How to Make a Bar Graph with BBQ Food
Worksheet
How to Make a Bar Graph with BBQ Food
Second Grade
Data and Graphing
Great food never goes out of style. Find out what the most popular barbecue foods are with this bar graph that teaches kids how to interpret data.
Worksheet
How to Make a Bar Graph with BBQ Food
Worksheet
How to Make a Bar Graph with BBQ Food
Great food never goes out of style. Find out what the most popular barbecue foods are with this bar graph that teaches kids how to interpret data.
Second Grade
Data and Graphing
Worksheet
Constructing Scatter Plots
Worksheet
Constructing Scatter Plots
Eighth Grade
Data and Graphing
Get students creating scatter plots using real-world data sets with this eighth-grade math worksheet!
Worksheet
Constructing Scatter Plots
Worksheet
Constructing Scatter Plots
Get students creating scatter plots using real-world data sets with this eighth-grade math worksheet!
Eighth Grade
Data and Graphing
Worksheet
Scaled Bar Graphs
Exercise
Scaled Bar Graphs
Third Grade
Data and Graphing
This exercise will clarify just how scaled bar graphs represent data found in math problems.
Exercise
Scaled Bar Graphs
Exercise
Scaled Bar Graphs
This exercise will clarify just how scaled bar graphs represent data found in math problems.
Third Grade
Data and Graphing
Exercise
Do a Survey! Favorite Veggies
Worksheet
Do a Survey! Favorite Veggies
Second Grade
Data and Graphing
Give your second grader some practice working with data with this fun-to-complete favorite veggie survey.
Worksheet
Do a Survey! Favorite Veggies
Worksheet
Do a Survey! Favorite Veggies
Give your second grader some practice working with data with this fun-to-complete favorite veggie survey.
Second Grade
Data and Graphing
Worksheet
Winter Temperatures
Worksheet
Winter Temperatures
Fourth Grade
Measurement
Your meteorologist in the making will investigate changes in temperature as she practices charting and graphing data.
Worksheet
Winter Temperatures
Worksheet
Winter Temperatures
Your meteorologist in the making will investigate changes in temperature as she practices charting and graphing data.
Fourth Grade
Measurement
Worksheet
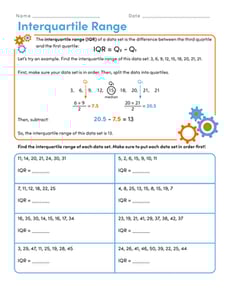
Interquartile Range
Interactive Worksheet
Interquartile Range
Sixth Grade
Statistics
In this sixth-grade statistics worksheet, students will practice finding the interquartile range of data sets.
Interactive Worksheet
Interquartile Range
Interactive Worksheet
Interquartile Range
In this sixth-grade statistics worksheet, students will practice finding the interquartile range of data sets.
Sixth Grade
Statistics
Interactive Worksheet
Creating Box Plots
Worksheet
Creating Box Plots
Sixth Grade
Data and Graphing
Learn to draw your own box plots to show data in this informative sixth-grade worksheet!
Worksheet
Creating Box Plots
Worksheet
Creating Box Plots
Learn to draw your own box plots to show data in this informative sixth-grade worksheet!
Sixth Grade
Data and Graphing
Worksheet
Pictographs: Say Cheese!
Worksheet
Pictographs: Say Cheese!
Third Grade
Data and Graphing
To keep track of his cheese sales, Giovanni uses a pictograph. Kids will figure out how his cheese business is doing by using data in the graph.
Worksheet
Pictographs: Say Cheese!
Worksheet
Pictographs: Say Cheese!
To keep track of his cheese sales, Giovanni uses a pictograph. Kids will figure out how his cheese business is doing by using data in the graph.
Third Grade
Data and Graphing
Worksheet
The Statistics of Sunspots
Activity
The Statistics of Sunspots
Engineering and Science Inquiry
This experiment will explore how manipulating a graph of historical information might reveal new information about data.
Activity
The Statistics of Sunspots
Activity
The Statistics of Sunspots
This experiment will explore how manipulating a graph of historical information might reveal new information about data.
Engineering and Science Inquiry
Activity
Make a Temperature Tracker
Activity
Make a Temperature Tracker
Fifth Grade
Geometry
Here's a fun at-home activity that will help your child strengthen math skills using high and low temperature data, and become a master temperature tracker!
Activity
Make a Temperature Tracker
Activity
Make a Temperature Tracker
Here's a fun at-home activity that will help your child strengthen math skills using high and low temperature data, and become a master temperature tracker!
Fifth Grade
Geometry
Activity
Analyzing a Census
Worksheet
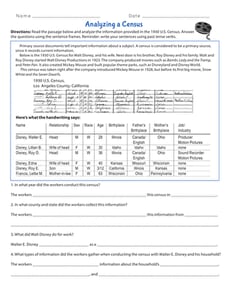
Analyzing a Census
Fourth Grade
Reading
It’s census time! Travel back to 1930 to analyze the census data for the household of Walt Disney.
Worksheet
Analyzing a Census
Worksheet
Analyzing a Census
It’s census time! Travel back to 1930 to analyze the census data for the household of Walt Disney.
Fourth Grade
Reading
Worksheet
Design an Experiment Part 4: Communicate the Findings
Worksheet
Design an Experiment Part 4: Communicate the Findings
Sixth Grade
Engineering and Science Inquiry
Wrap up your experiment and share your results with the world in this helpful template!
Worksheet
Design an Experiment Part 4: Communicate the Findings
Worksheet
Design an Experiment Part 4: Communicate the Findings
Wrap up your experiment and share your results with the world in this helpful template!
Sixth Grade
Engineering and Science Inquiry
Worksheet
Interpreting Emotion Through Facial Microexpressions
Activity
Interpreting Emotion Through Facial Microexpressions
Engineering and Science Inquiry
This middle school science fair project evaluates test subjectsâ ability to determine what a person is feeling by reading their facial microexpressions.
Activity
Interpreting Emotion Through Facial Microexpressions
Activity
Interpreting Emotion Through Facial Microexpressions
This middle school science fair project evaluates test subjectsâ ability to determine what a person is feeling by reading their facial microexpressions.
Engineering and Science Inquiry
Activity
Encoding Digital Images
Activity
Encoding Digital Images
Engineering and Science Inquiry
Science fair project about different digital image file types, compares different encoding algorithms used to compress the data.
Activity
Encoding Digital Images
Activity
Encoding Digital Images
Science fair project about different digital image file types, compares different encoding algorithms used to compress the data.
Engineering and Science Inquiry
Activity
Picnic Bar Graph
Worksheet
Picnic Bar Graph
Second Grade
Data and Graphing
Which picnic games do you prefer? This bar graph shows some of the most popular picnic activities. Students will learn about analyzing data from a bar graph.
Worksheet
Picnic Bar Graph
Worksheet
Picnic Bar Graph
Which picnic games do you prefer? This bar graph shows some of the most popular picnic activities. Students will learn about analyzing data from a bar graph.
Second Grade
Data and Graphing
Worksheet
1
…
4
5
6
…
65